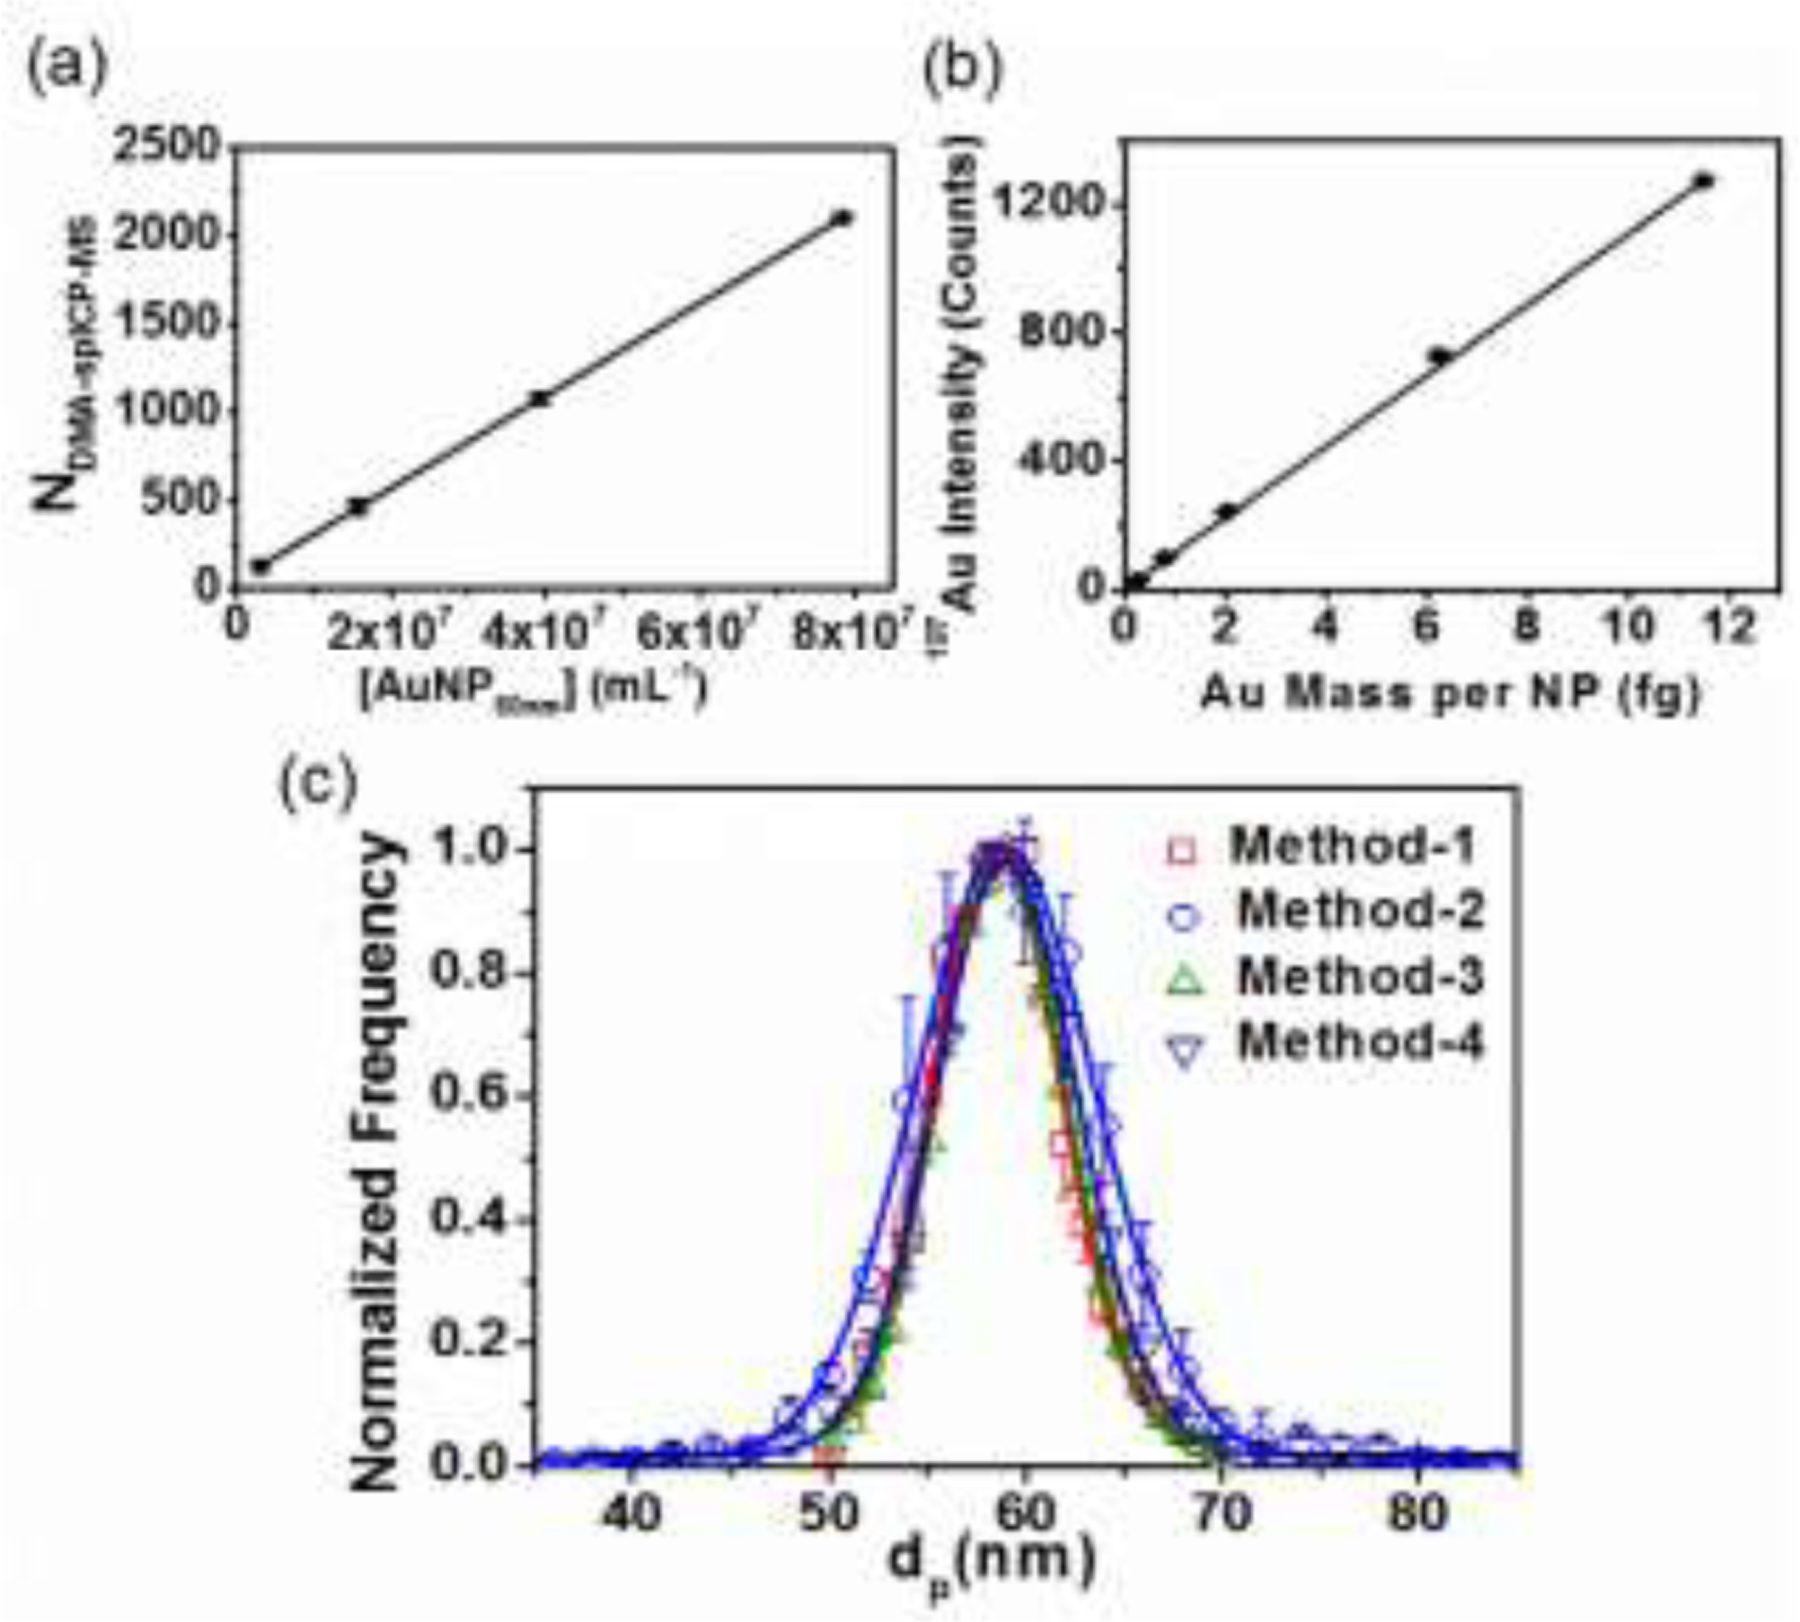
Figure 3.

(a) Number concentration calibration curve (60 nm AuNP). (b) Mass calibration curve based on AuNPs of various sizes (30 nm, 60 nm, and 40 nm, 80 nm and 100 nm AuNPs). Au mass per NP was calculated based on DMA mobility equivalent spherical size. (c) Comparison of PSD for 60 nm AuNPs measured by DMA-spICP-MS and other conventional methods: Method-1: by summation of particle spikes over each DMA step by DMA-spICP-MS; Method-2: by single particle event intensity from DMA-spICP-MS; Method-3: by conventional DMA-CPC; Method-4: by single particle event intensity from conventional stand-alone spICP-MS. Lines represent Gaussian fits applied to each set of data. Error bars, if not visually apparent, are smaller than the symbols and are based on one standard deviation from at least two replicate runs.
