
Figure 4.
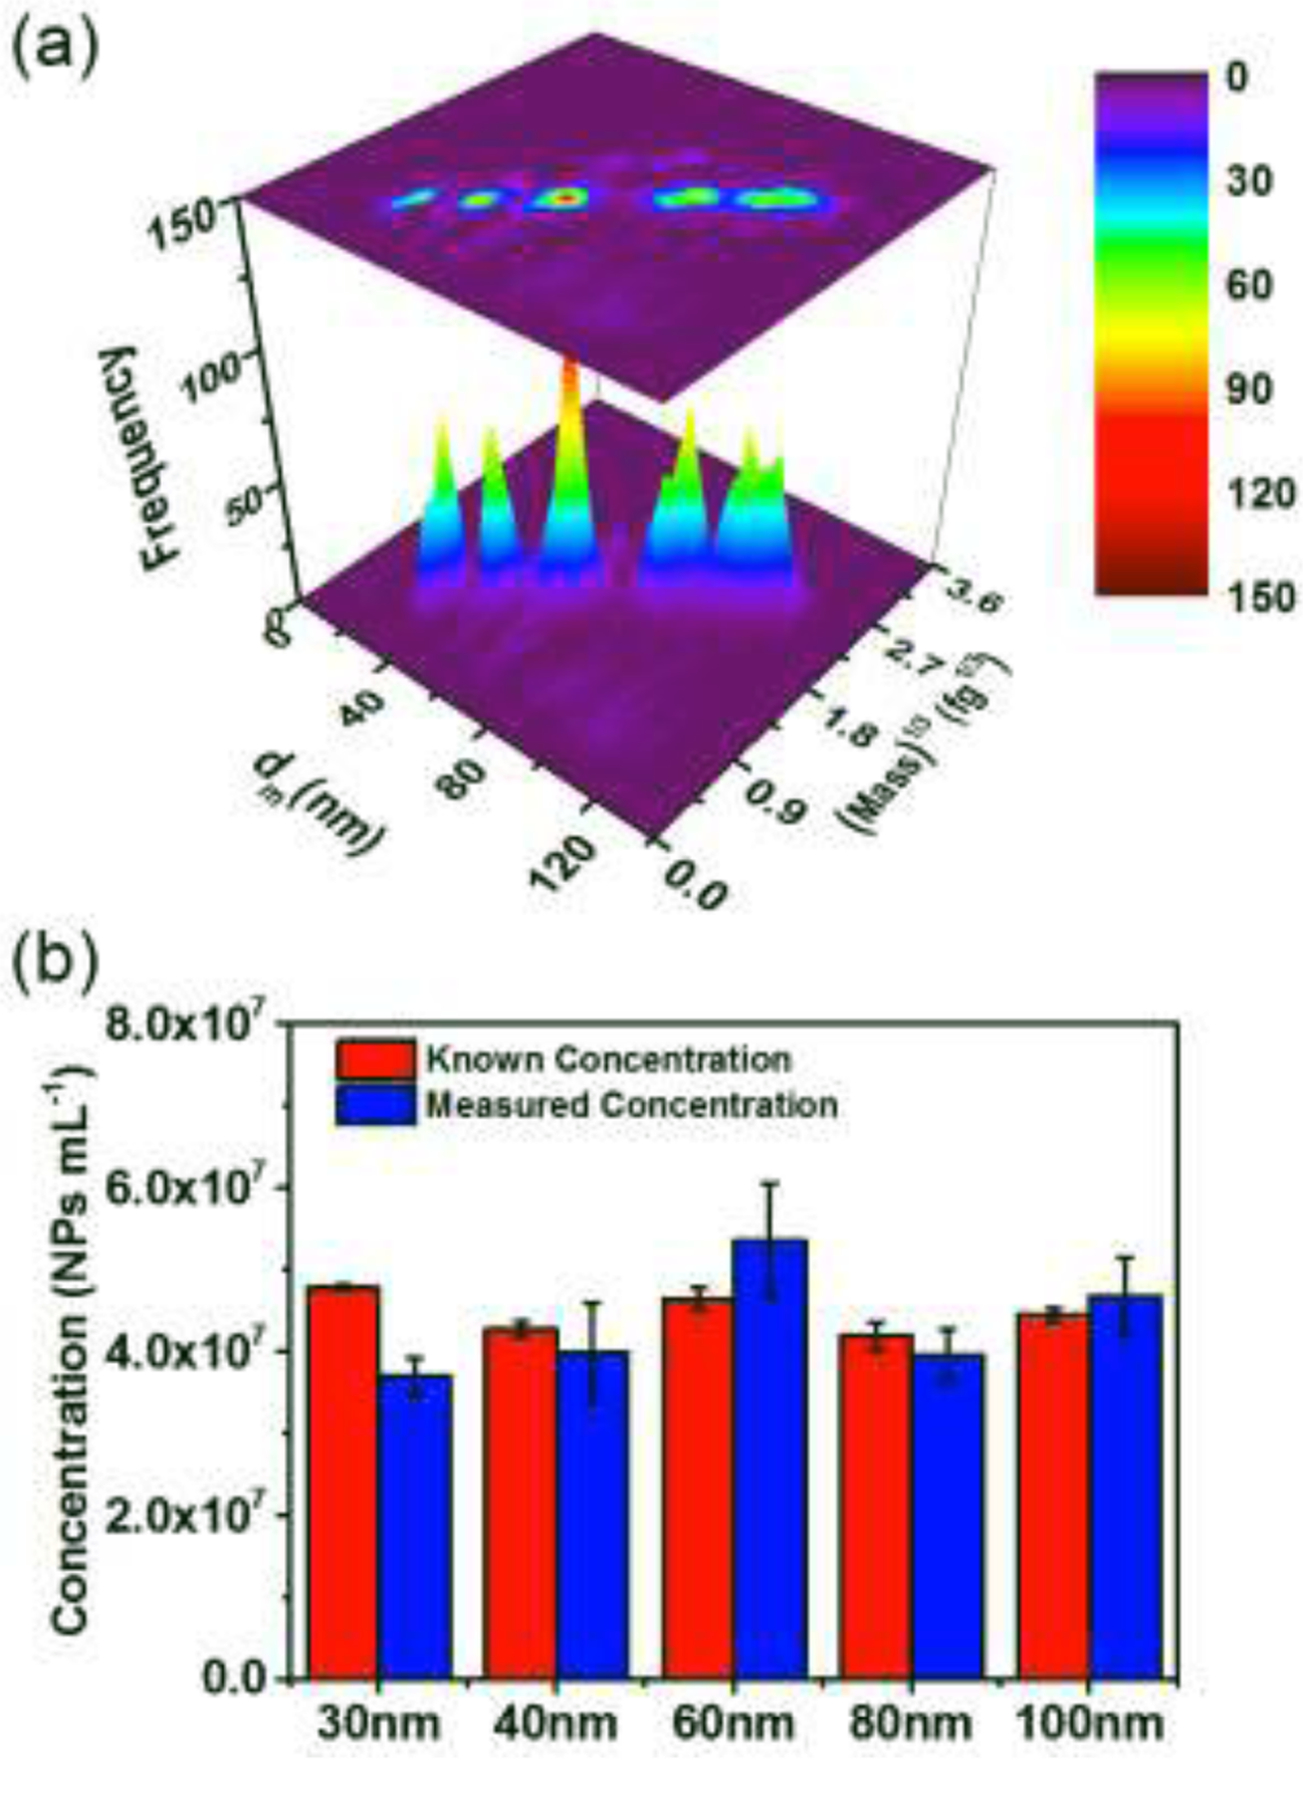
(a) Plot of size, mass1/3 and concentration (frequency of NPs) for mixtures containing five sizes of AuNPs as obtained by ES-DMA-spICP-MS. (b) Comparison between measured and known NP concentration initially mixed for five different sizes. Error bars represent one standard deviation for three replicate measurements. The known concentration initially mixed was based on independent relative number concentration measurement for all five different sizes by stand-alone spICP-MS and normalized to known 60 nm AuNPs concentration from certificate.