Figure 1.
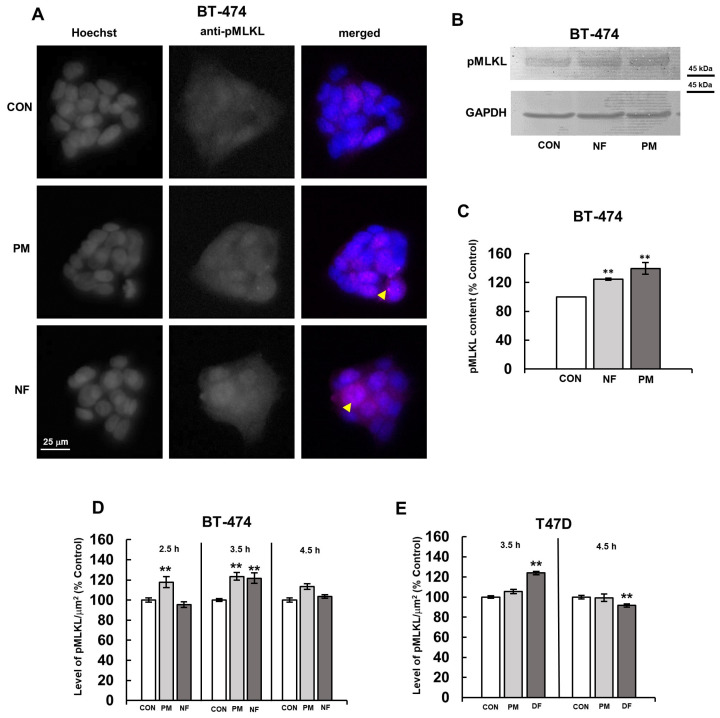
Dermatan sulfate (DS) rapidly induced the activation of the necroptotic executor MLKL in luminal breast cancer cells with dynamics that were dependent on its structure. (A) The representative images showing the maximum effect of the structural variants of DS (PM–DS from porcine intestinal mucosa and NF–DS from normal human fascia) on the activation of MLKL in the BT-474 cell line. The cells were exposed to 25 µg/mL of an individual DS variant for 3.5 h. The activated MLKL was detected using the monoclonal antibody against phospho-S358 (Abcam) at a 1:300 dilution; the nuclei were stained with Hoechst. Arrowheads indicate large oligomers of phospho-MLKL. (B) The representative Western blotting analysis of the PM- or NF-mediated effect on the level of phospho-MLKL in the BT-474 cells that had been exposed to each of these variants at a concentration of 25 µg/mL for 3.5 h. Then, the cells were lysed in RIPA buffer, and the cellular proteins (15 µg) were submitted to SDS-PAGE. The obtained blots were probed with monoclonal anti-phospho-MLKL (Abcam) at a dilution of 1:1000. Original Western blots can be found in Supplementary Materials. (C) Quantitative analysis of the obtained immunoblots, illustrating the maximum DS variant-promoted effect on the activation of MLKL in the BT-474 cells. The levels of phospho-MLKL were normalized to the GAPDH content. The results are expressed as the mean ± SD of three independent experiments. **—statistically significant differences (p < 0.01) versus the control. (D,E) The kinetics of the DS variant-mediated activation of MLKL in the BT-474 (D) and T-47D (E) cells. The cells were incubated with the DS variants (PM, NF or DF–DS from fibrosis-affected human fascia) for the indicated time periods. The activation of MLKL was estimated as the fluorescence per µm2 for all of the visible cells in six non-overlapping fields from each of the five independent experiments. The results are expressed as the percentage of the effect visible in the untreated controls and are presented as the mean ± SEM that was calculated for all of the obtained images. **—statistically significant differences (p < 0.01) versus the control.

