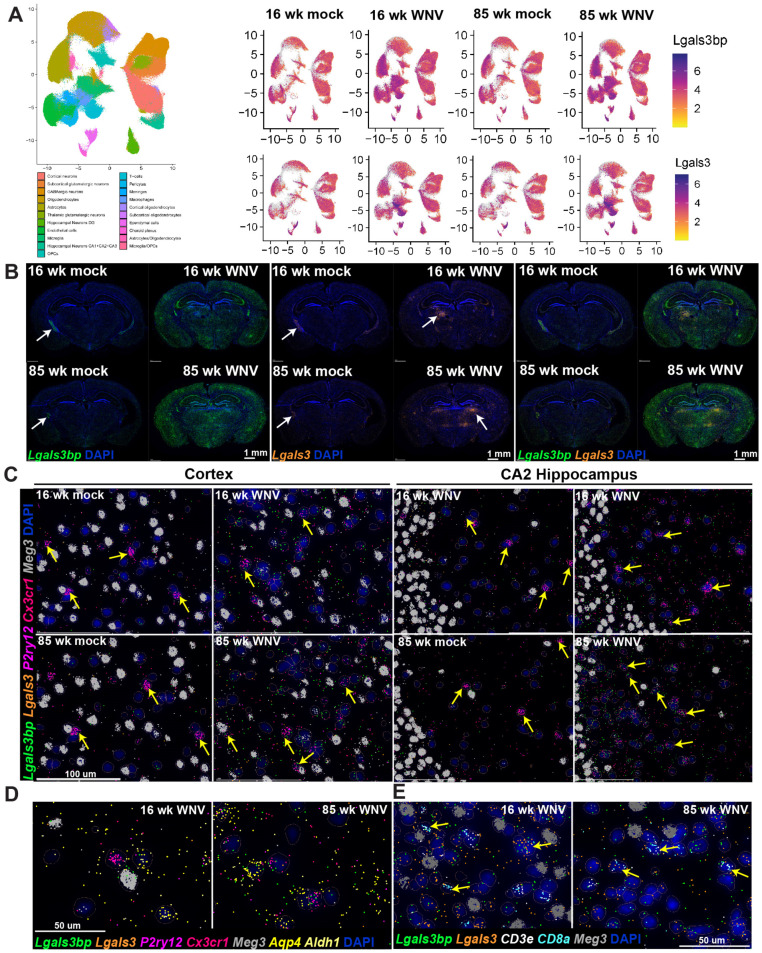
Figure 3.
Lgals3bp expression in mouse brain visualized using MERFISH. (A) Lgals3bp and Lgals3 expression scatter plot in identified cell types. (B) Spatial imaging of Lgals3bp (green) and Lgals3bp (orange) in coronal section of mouse brains from 16- or 85-week-old animals infected with mock or WNV, visualized at 30 DPI. Arrowheads point at persistent inflammatory foci observed in infected samples. Scale bar = 1 mm. (C) Lgals3bp (green), Lgals3 (orange), P2ry12 (magenta), Cxcr1 (coral), and Meg3 (gray) expression in mouse cortex (left panel) or CA2 region of the hippocampus (right panel). Arrowheads indicate microglial cells. Scale bar = 100 µm. (D) Lgals3bp (green), Lgals3 (orange), P2ry12 (magenta), Cx3cr1 (coral), Meg3 (gray), Aqp4 (yellow), and Aldh1 (light yellow) expression in the CA2 region of the hippocampus of WNV-infected mice. Scale bar = 50 µm. (E) Lgals3bp (green), Lgals3 (orange), CD3e (white), CD8a (cyan) and Meg3 (gray) expression visualized in inflammatory foci observed in the brain of WNV-infected animals at 30 DPI. Arrowheads point at CD8+ cells. Scale bar = 50 µm. DAPI staining is in blue across the figure.

