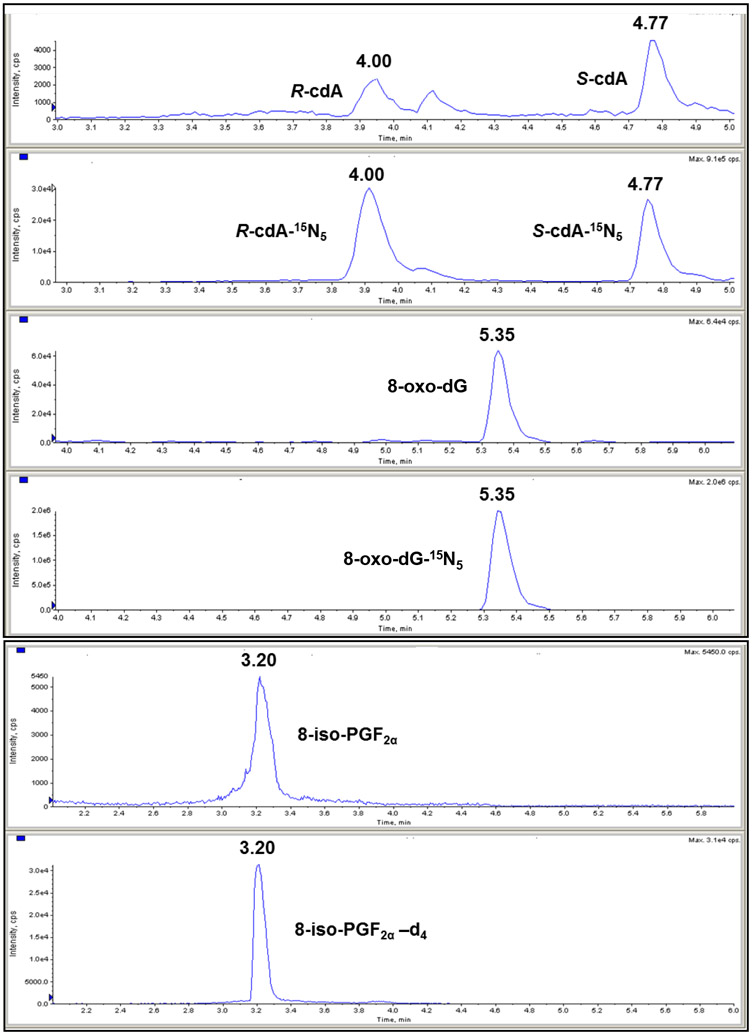
Fig. 1.
Representative ion-current profiles of the mass transitions m/z 250 → m/z 164 (R-cdA and S-cdA), m/z 255 → m/z 169 (R-cdA-15N5 and S-cdA-15N5), m/z 284 → m/z 168 (8-oxo-dG), m/z 289 → m/z 173 (8-oxo-dG-15N5), m/z 353 → m/z 193 (8-iso-PGF2α ) and m/z 357 → m/z 197 (8-iso-PGF2α -d4), which were recorded during the LC-MS/MS analysis. It should be noted that R-cdA, S-cdA, R-cdA-15N5, S-cdA-15N5, 8-oxo-dG and 8-oxo-dG-15N5 were measured simultaneously, whereas the measurement of 8-iso-PGF2α and 8-iso-PGF2α -d4 was performed in a separate analysis.

