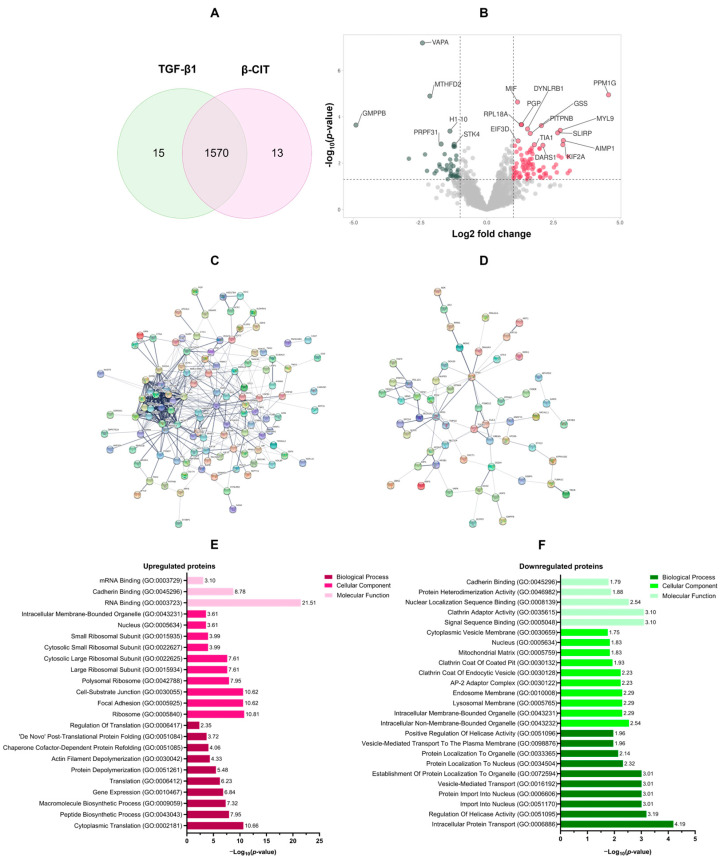
Figure 3.
The functional enrichment analysis of DEPs. Quantitative LC-MS/MS analysis yielded a total of 1570 differentially expressed proteins (DEPs) (A). Volcano plots visually demonstrated the upregulated (n = 125, red) and downregulated (n = 65, green) proteins within this dataset (B). To elucidate potential functional relationships, protein–protein interaction (PPI) network analyses were performed separately for the upregulated (C) and downregulated (D) protein subsets. Gene ontology (GO) annotations illuminated key biological processes associated with both upregulated (E) and downregulated (F) DEPs.

