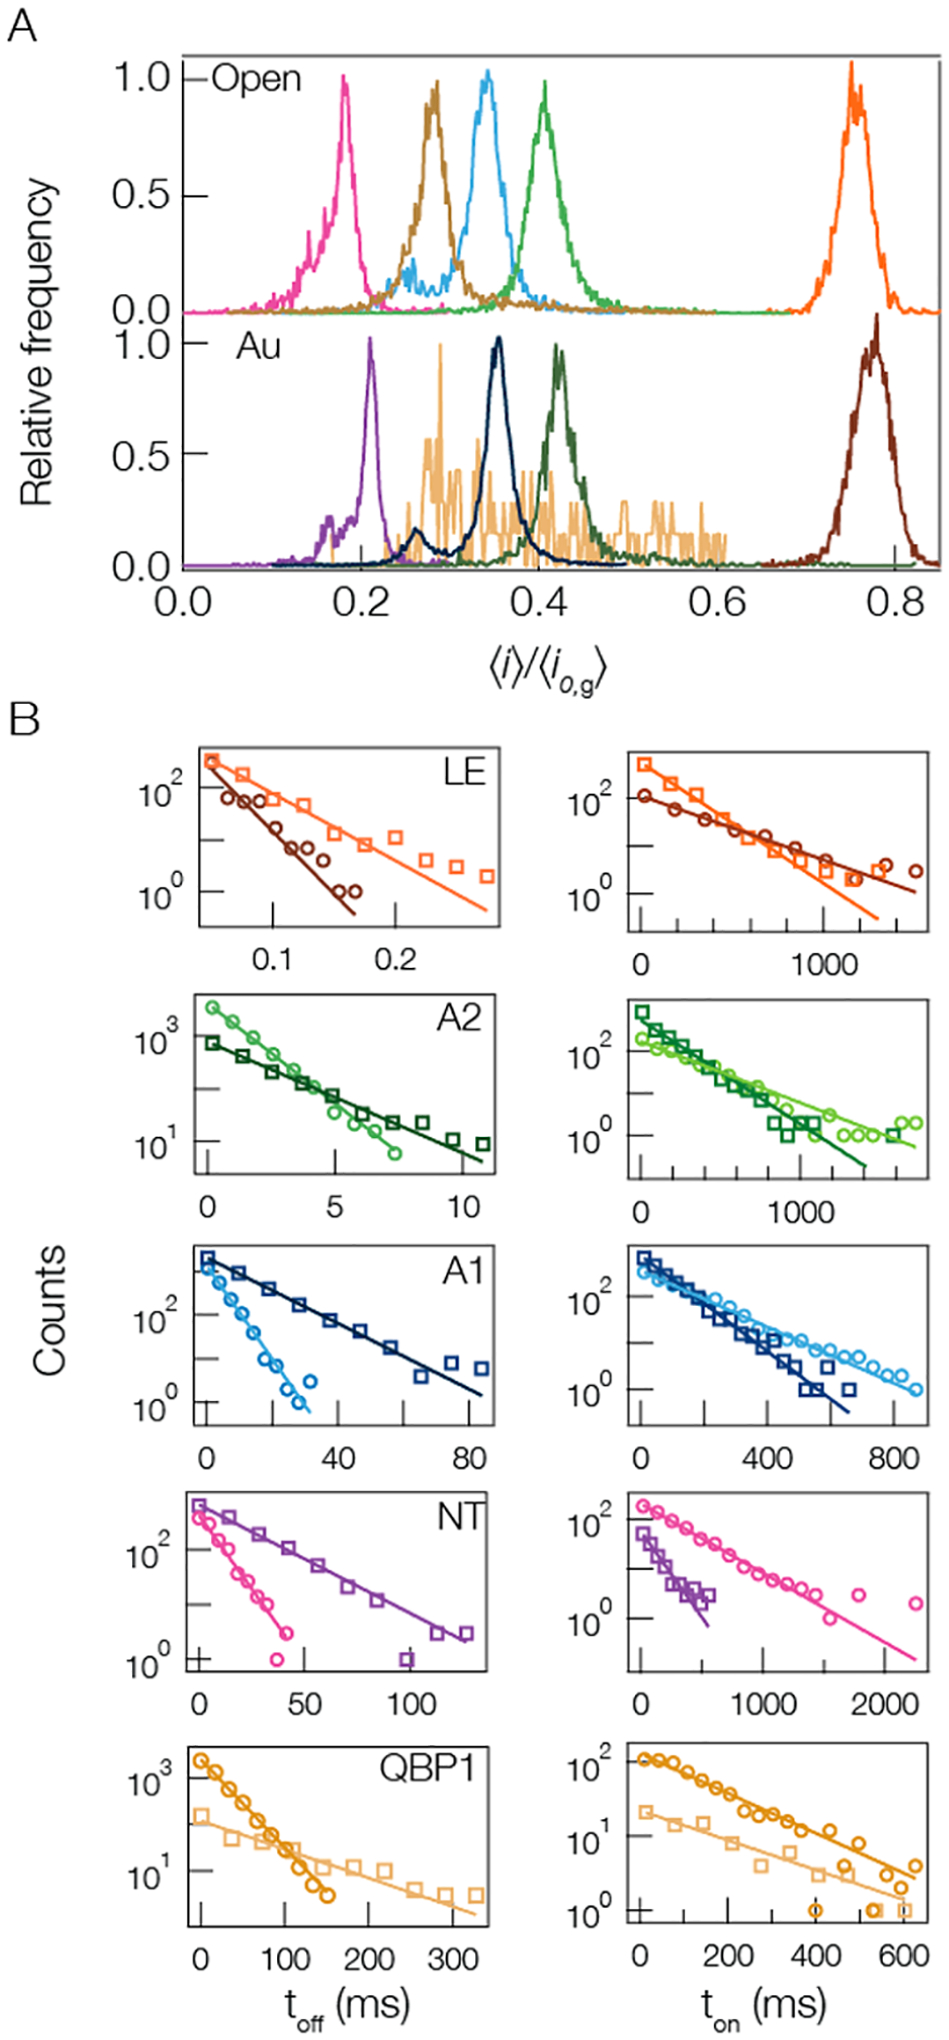
Figure 2.

Cluster-enhanced SMNS peptide detection. (A) Representative current blockade distributions for the five different peptides studied ((pink) NT, (gold) QBP1, (blue) A1, (green) A2, and (orange) LE) give rise to current blockade distributions dominated by single peaks with (bottom) and without (top) a gold cluster in the pore. The distributions for the open (gold-occupied) pore configuration are calculated from NT = 2225 (2434), QBP1 = 6649 (177), A1 = 3984 (13130), A2 = 7188 (1845), and LE = 535 (714) blockade events. (B, left column) The corresponding blockade residence time (toff) distributions with (squares) and without (circles) a gold cluster in the pore show that the cluster yields longer lived events. The solid lines correspond to least-squares fits to the data with single exponential functions from which the mean residence time τres is extracted. (B, right column) The time between event starts (ton) distributions, with (squares) and without (circles) a gold cluster in the pore, show that the cluster-based detection yields increased on-rate with a cluster in the pore (except for the QBP1). The solid lines correspond to single exponential functions from which the mean on-rate kon is extracted. All data shown here, unless otherwise noted, was taken under the following conditions: 3 M KCl, pH 7.2, 70 mV applied transmembrane voltage, [peptide] = 20 μM. Each peptide’s open and gold-occupied data was collected on the same pore. See Table S2 in Supporting Information for complete results for peak i/io,g values, τres, and kon.
