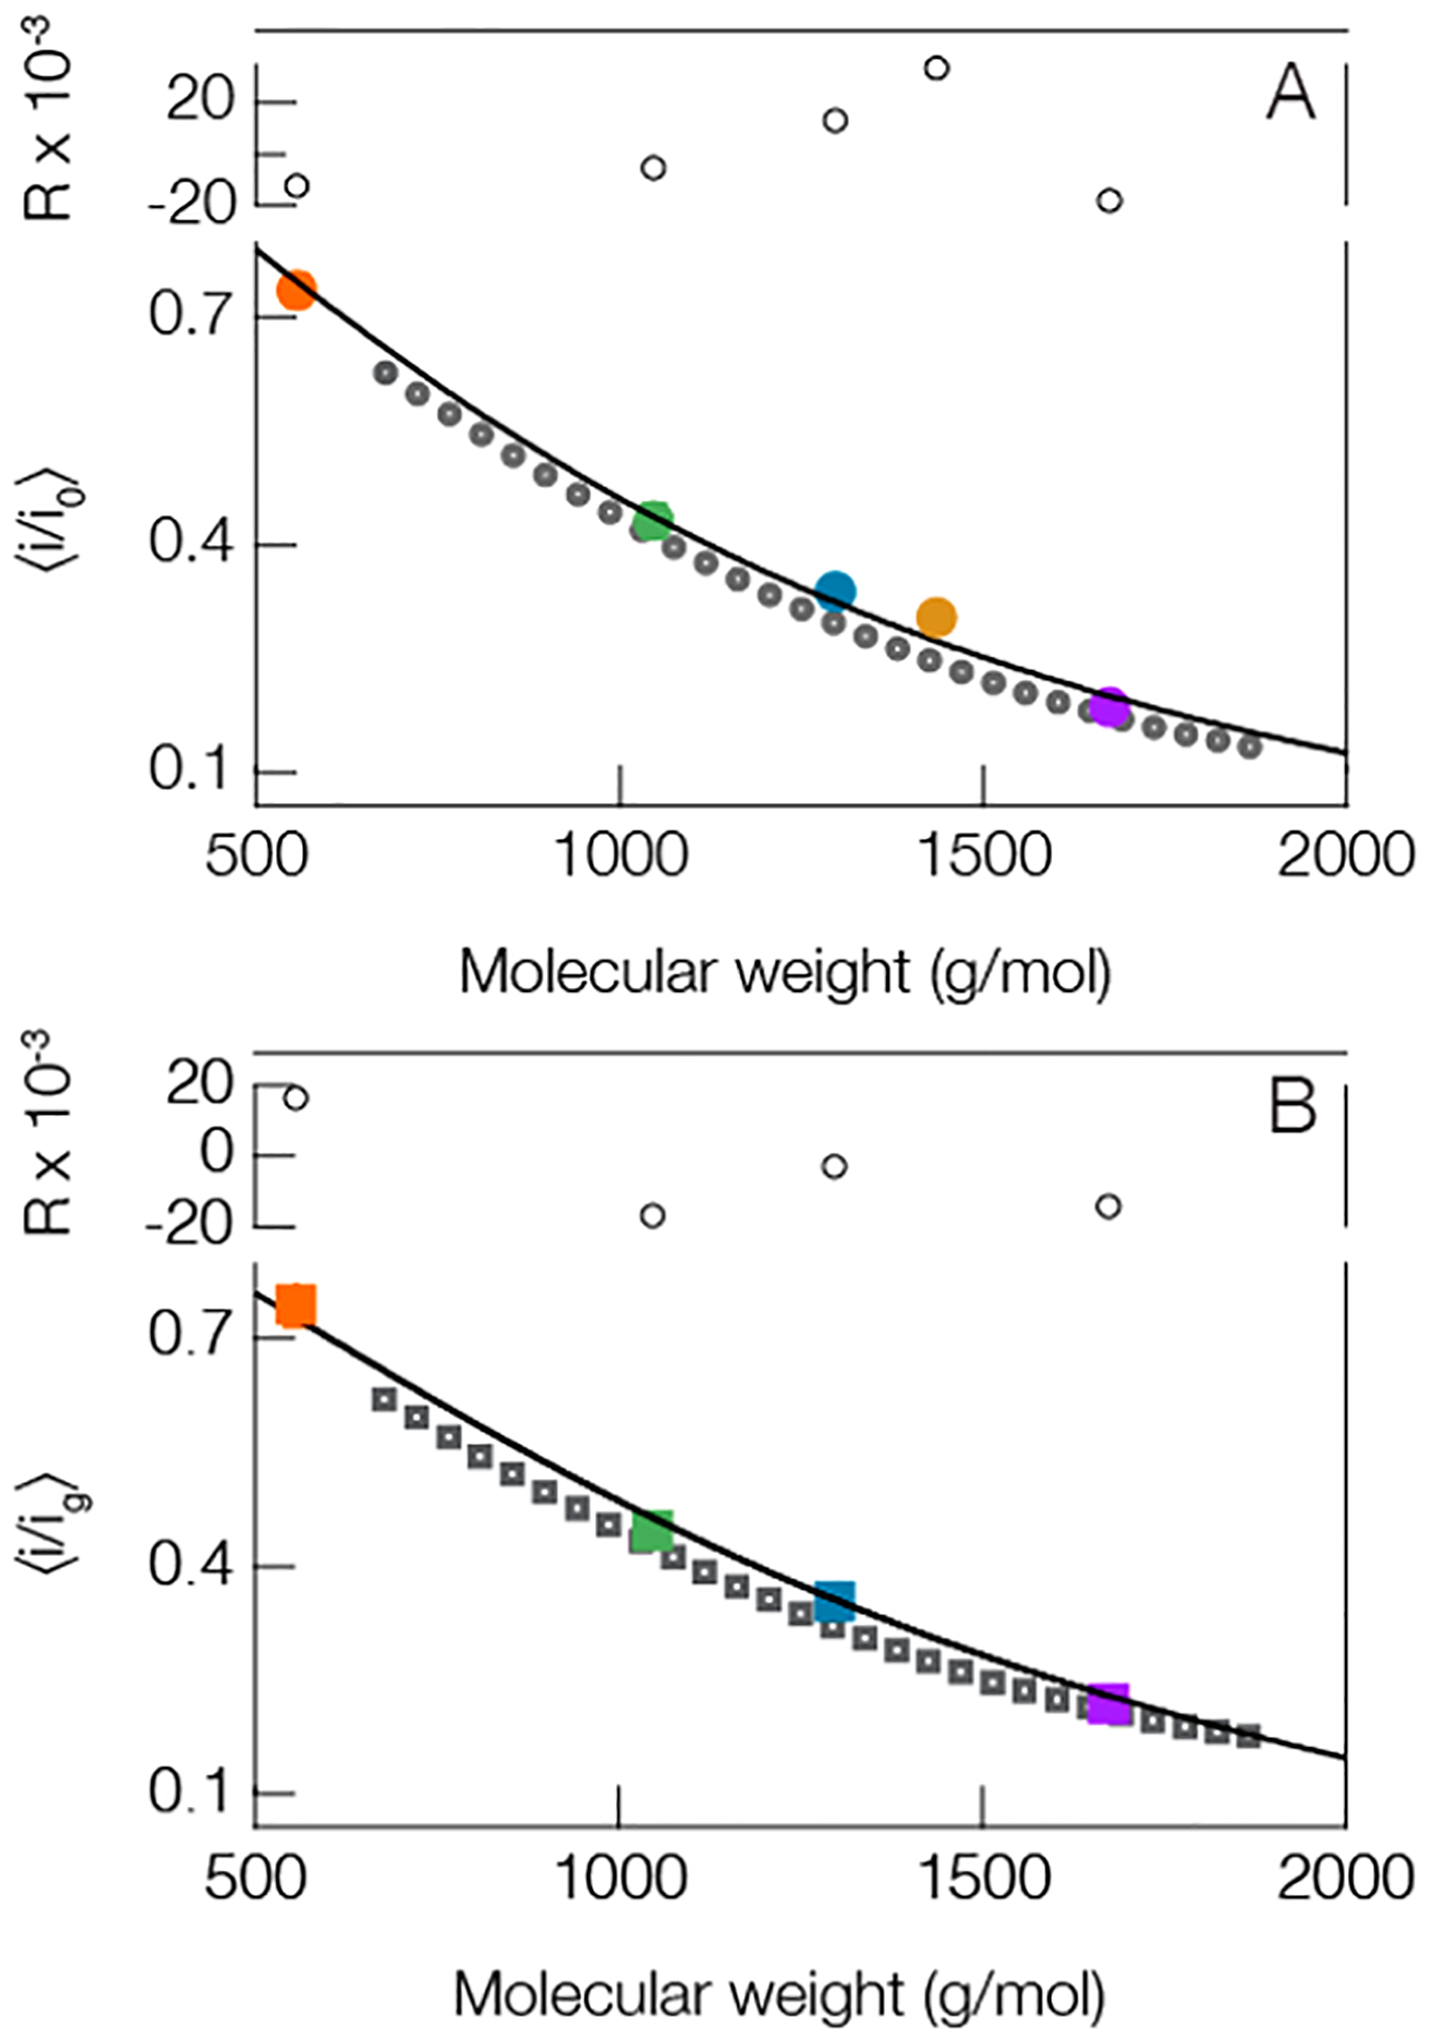
Figure 3.

Peptides and PEG show a similar trend between mean current blockade depth and molecular weight. This suggests that one could deduce the size of peptides from the blockade depth. (A, solid circles) open pore and (B, solid squares) gold occupied pore both show a similar trend. The solid line in the open pore case is a least-squares fit to the peptides only (colored circles, same colors used in Figure 2) using eq 1 with fit parameters a = 1.68 ± 0.12 and γ = 0.34 ± 0.06. The solid line in the lower figure corresponds to eq 2 from the main text. This model utilizes one free parameter that quantifies the interaction strength between the peptides and cluster and was found to be d = 0.13 ± 0.04. The QBP1 in the gold cluster case is excluded because of the limited number of gold-state events. This is expected given QBP1, and the gold clusters are negatively charged. Blockade peak positions were calculated from the means of at least three different experiments (see Table S2 in Supporting Information for complete details). The residuals (R) for each fit are shown above each figure. All measurements were performed in 3 M KCl under an applied 70 mV transmembrane potential at pH 7.2 with peptide concentrations of 20 μM. The dark gray open circles in (A) and the dark gray open squares in (B) correspond to PEG blockades which are not included in the fitting protocol. All error bars are smaller than the data points shown, but they are reported in Table S2 in the Supporting Information.
