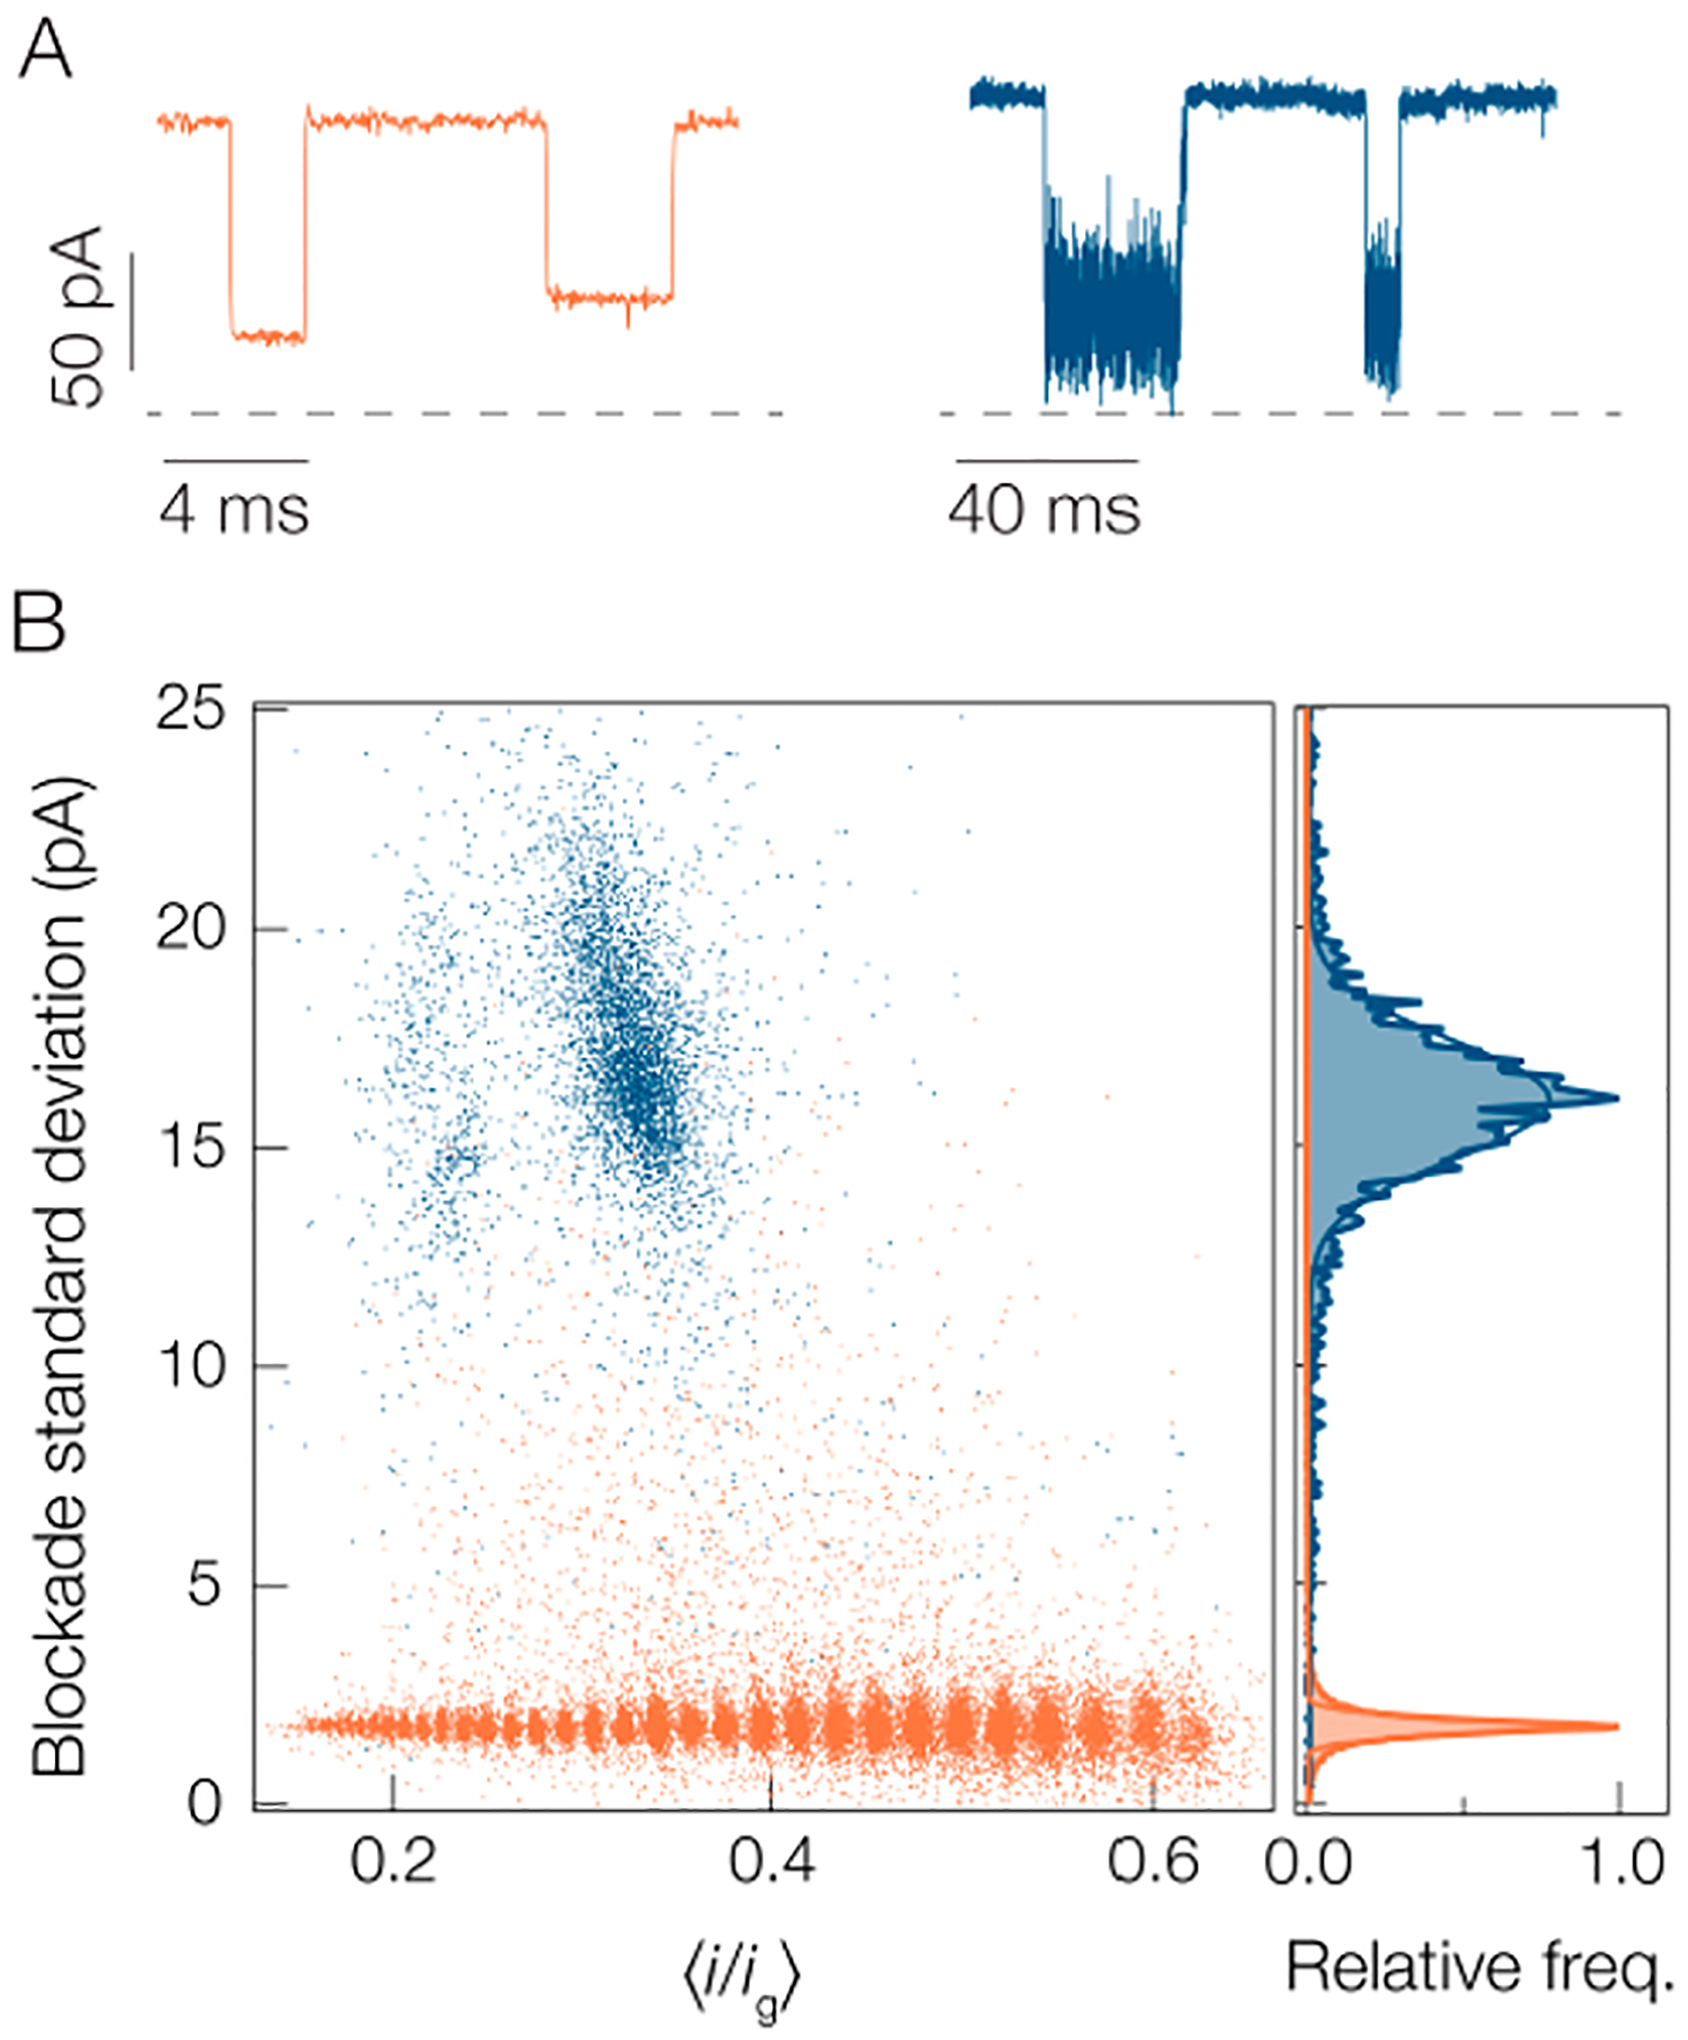
Figure 4.

Standard deviation of blockades is greater for peptides than PEG, which complicates the application of the SMNS technique to peptide detection. (A) Sample current traces show that the noise within individual blockades is smaller for the PEG (orange) than the A1 peptide (blue). The apparent difference in noise levels in the open states results from the 10× difference in time scales between the two traces. (B) Scatter distribution of current blockade standard deviations for A1 (blue) and PEG (orange). The right outset shows the distributions for each species from which the peaks of each distribution are found to be (1.75 ± 0.26) pA for PEG and (16.1 ± 1.9) pA for A1. Data was collected in 3 M KCl pH 7.2 solution under a 70 mV applied transmembrane potential with a gold cluster in the pore. The PEG blockades arise from a polydisperse mixture of [PEG 600] = 2 μM, [PEG 1000] = [PEG 1500] = 10 μM, [PEG n = 12] = 0.5 μM, and [PEG n = 28] = 1 μM.
