
Figure 7.
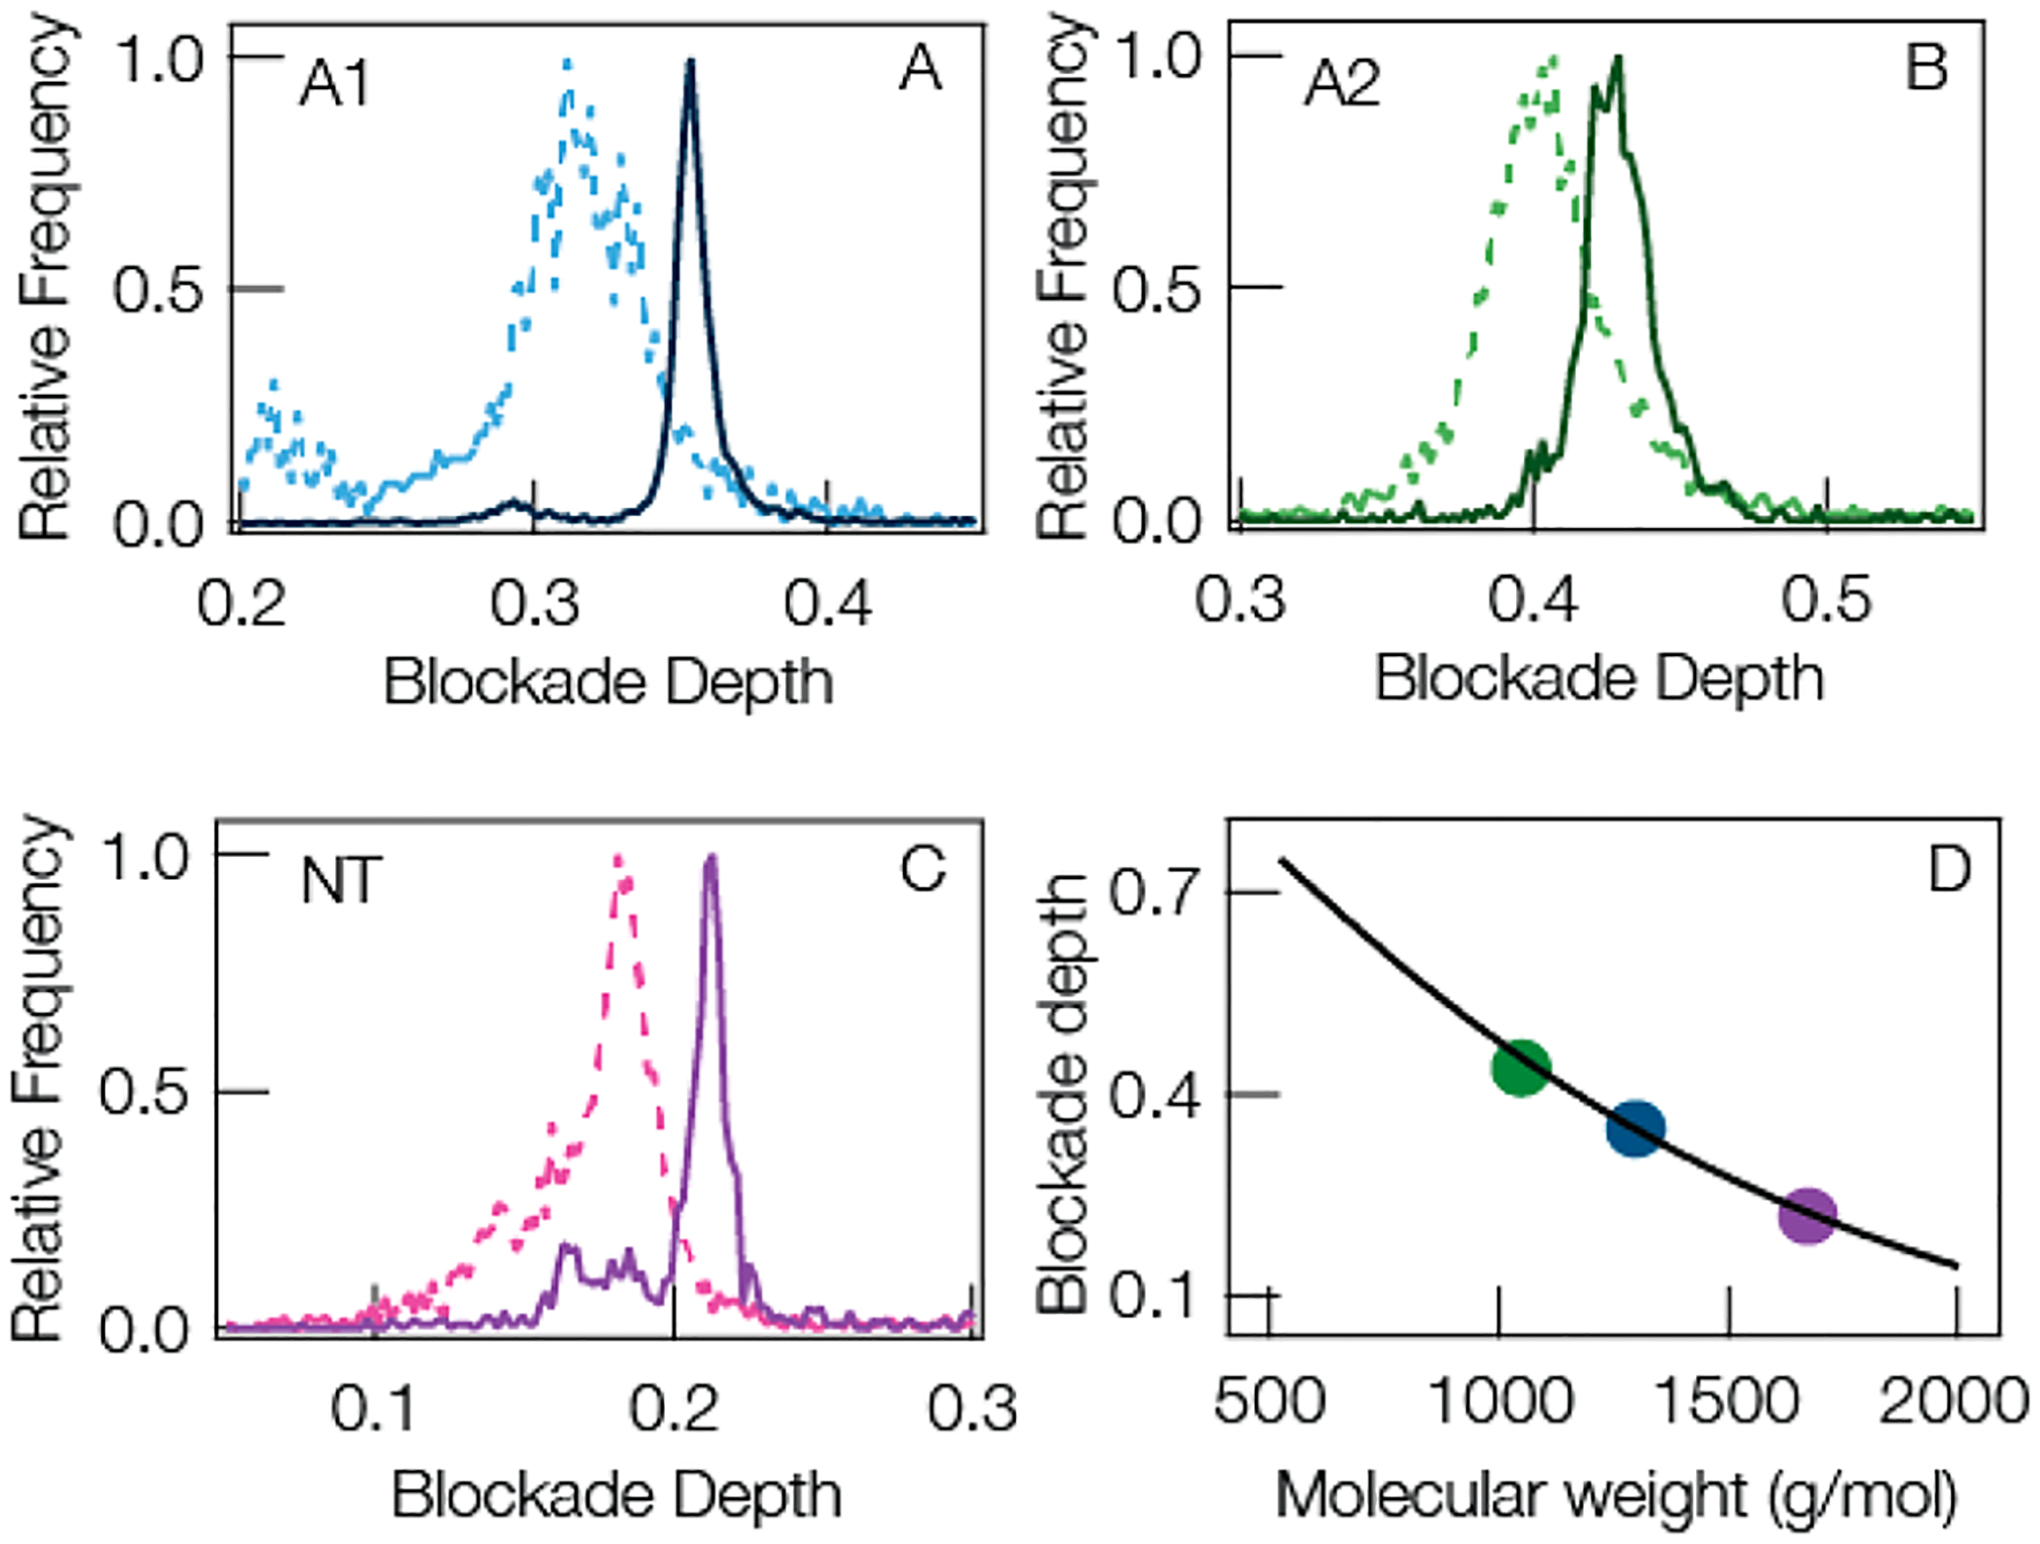
(A–C) Representative current blockade distributions show narrower peaks for (A) angiotensin I, (B) angiotensin II, and (C) neurotensin by increasing the mean residence time with a gold cluster in the pore and reducing fluctuations by modifying solution conditions. The dashed lines show the blockade distributions for the open pore at pH 7.2. The solid lines show pH 5.8 1 M Gdm-HCl added to the trans-side and a gold cluster in pore. (D) The peak positions of the optimized peaks (solid curves in A,B,C) (solid circles) are well described by the model shown in eqs 1 and 2. The solid line is a reproduction of the least-squares fit from Figure 3B. All data was taken under the following conditions: 3 M KCl, 70 mV applied transmembrane potential, [peptide] = 20 μM on the trans-side of the pore.