Figure 1.
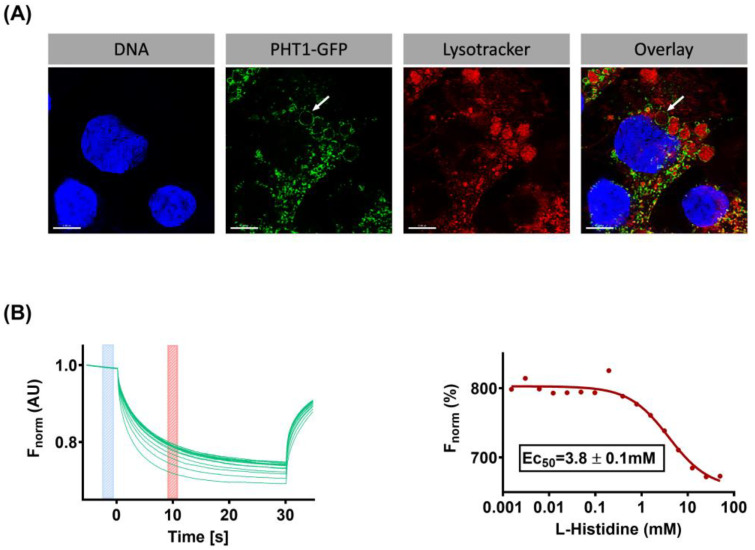
Fluorescence imaging of the HEK293 PHT1-GFP OE cell line and assessment of PHT1-GFP functional activity by microscale thermophoresis (MST). (A) Representative image showing the fluorescence signal emitted at different wavelengths by the fluorophores Hoechst (DNA staining; blue colour), GFP (PHT1-GFP overexpression; green colour), and Lysotracker (acidic compartment staining; red colour). Overlay of the different fluorescence signals (right panel). An illustrative example of the location of PHT1-GFP in lysosomal membranes is indicated by an arrow. The depicted scale bars correspond to 5 µm. (B) (Left panel) MST traces showing fluorescence measurement upon IR stimulation of capillaries loaded with a membrane preparation isolated from HEK293PHT1-GFP OE cells and different concentrations of L-histidine (0.0015–50 mM). Time points selected to calculate the change in fluorescence (ΔF) upon IR stimulation are indicated by blue (Fcold) and red (Fhot) bars; ΔF = ‖Fhot–Fcold‖. (Right panel) Individual ΔF values were plotted against their corresponding L-histidine concentrations. The fit of the data to Hill’s equation (red line) and the calculated Ec50 ± SD are shown.

