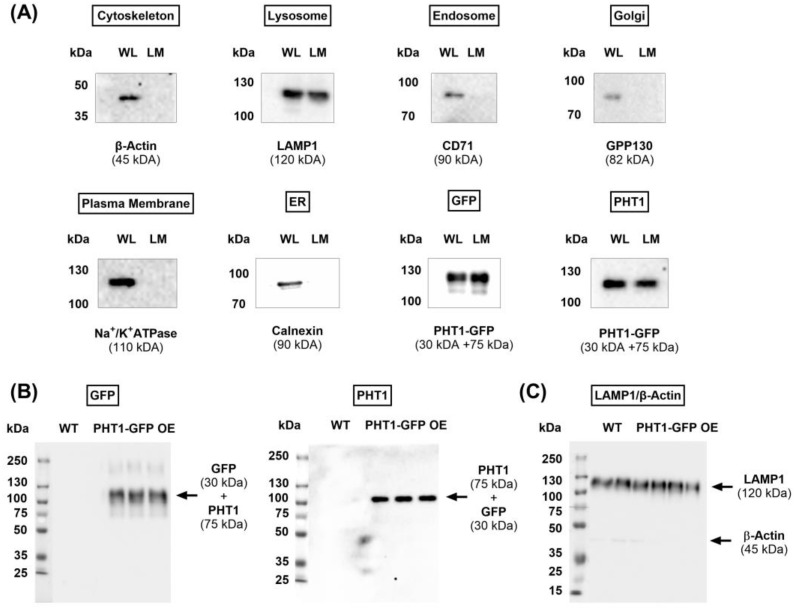
Figure 2.
Western blot analysis of the expression levels of subcellular markers and PH1-GFP. (A) Representative blots showing the protein expression of the indicated subcellular markers in whole-cell lysate (WL) and lysosomal membrane preparations isolated from the PHT1-GFP OE HEK293 cell line. (B) Representative blots showing protein expression of GFP (left panel), PHT1 (middle panel) and LAMP1 and β-actin (C) in lysosomal membrane preparations isolated from the indicated cell lines. Expected protein size for each target is indicated between brackets. Protein ladder was overlaid in whole-blot images (B) to illustrate the size of the detected bands. Original Western blot images are available in Supplementary Materials.

