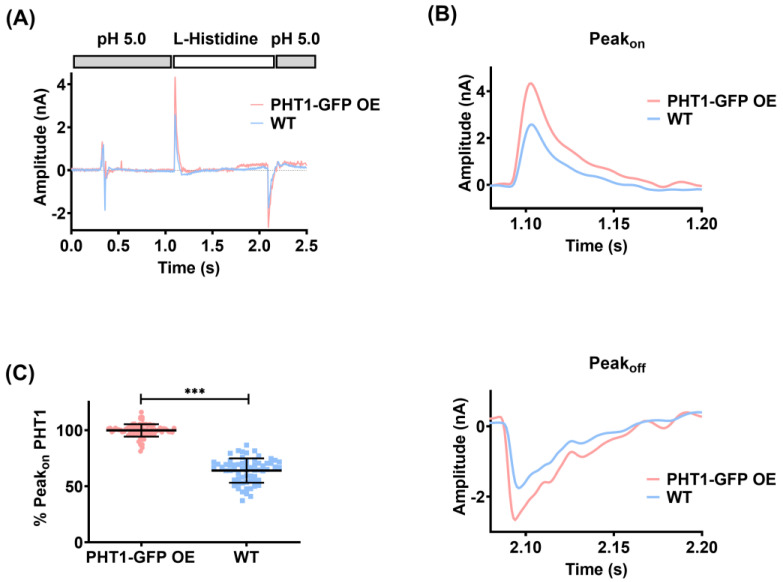
Figure 3.
Assement of PHT1-GFP functional activity by solid-supported membrane-based electrophysiology (SSME). (A) Current traces recorded with gold sensors loaded with lysosomal fractions isolated from the indicated cell lines using a single solution exchange protocol BAB. Perfusion of non-activating (B) and activating solution (A) is indicated at the top of the graph by grey (B) and white (A) squares, respectively. The non-activating solution (B) is 10 mM citric acid pH 5.0 buffer, while activating solution (A) is solution B supplemented with 10 mM L-histidine. (B) Close-up view of Peakon and Peakoff currents shown in C. (C) Statistical comparison of the mean ± SD of normalized Peakon currents recorded with gold sensors loaded with lysosomal fractions isolated from HEK293 PHT1-GFP OE (red dots; N = 83) or HEK293 WT cells (blue squares; N = 64). ***; corresponds to p < 0.001.

