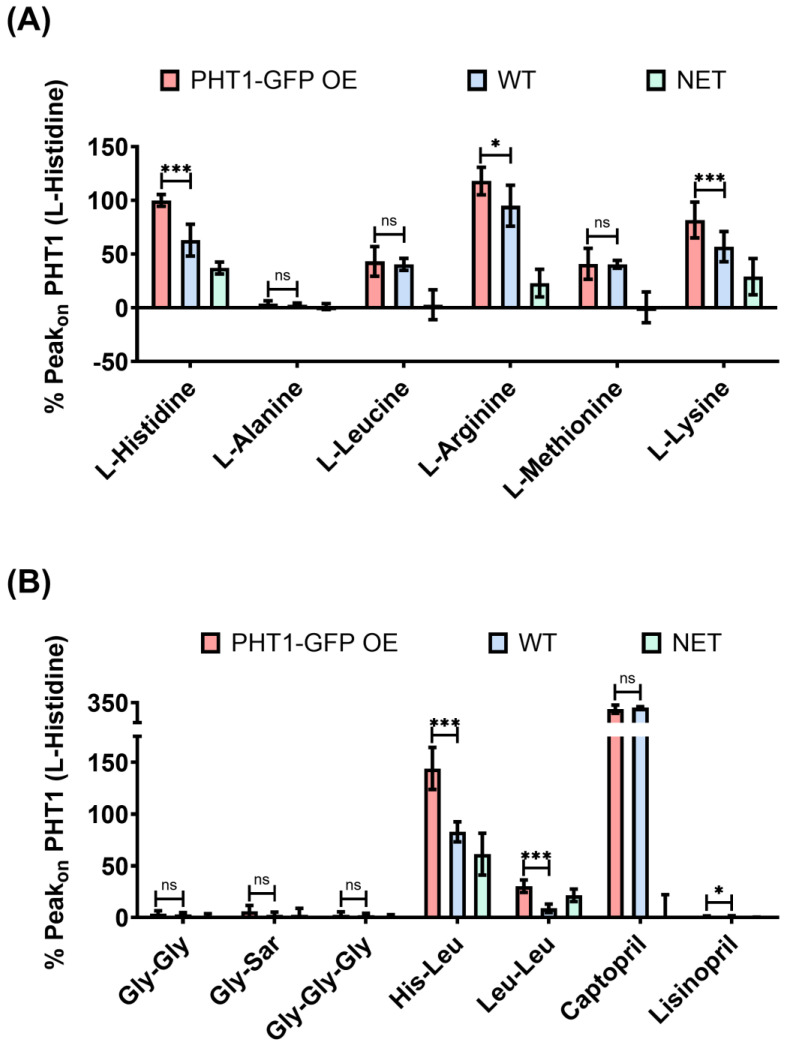
Figure 4.
Substrate selectivity of PHT1-GFP by SSME. Statistical comparison of the mean ± SD Peakon currents recorded for a series of AAs (A) and peptides (B) perfused at a concentration of 10 mM. To average currents recorded on different gold sensors Peakon currents were normalized to the L-histidine current. Recordings were obtained with gold sensors loaded with lysosomal fractions isolated from HEK293 PHT1-GFP OE (red bars) or HEK293 WT cells (blue bars). The Net current for each substrate (green bars) was calculated by subtracting the mean Peakon current calculated for the WT cells to each of the Peakon currents recorded for the same substrate with the HEK293 PHT1-GFP OE cells. Statistical significance levels are indicated as follows: ns; p > 0.05; *; p < 0.05; ***; p < 0.001.

