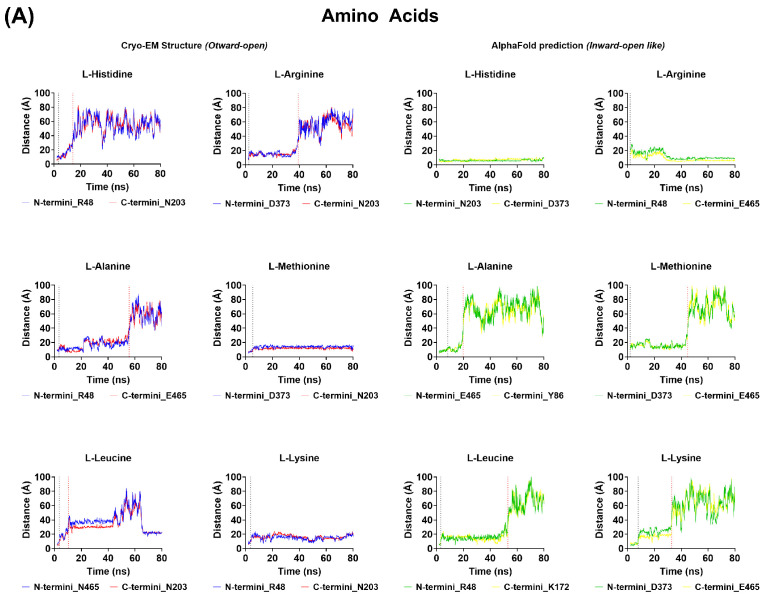
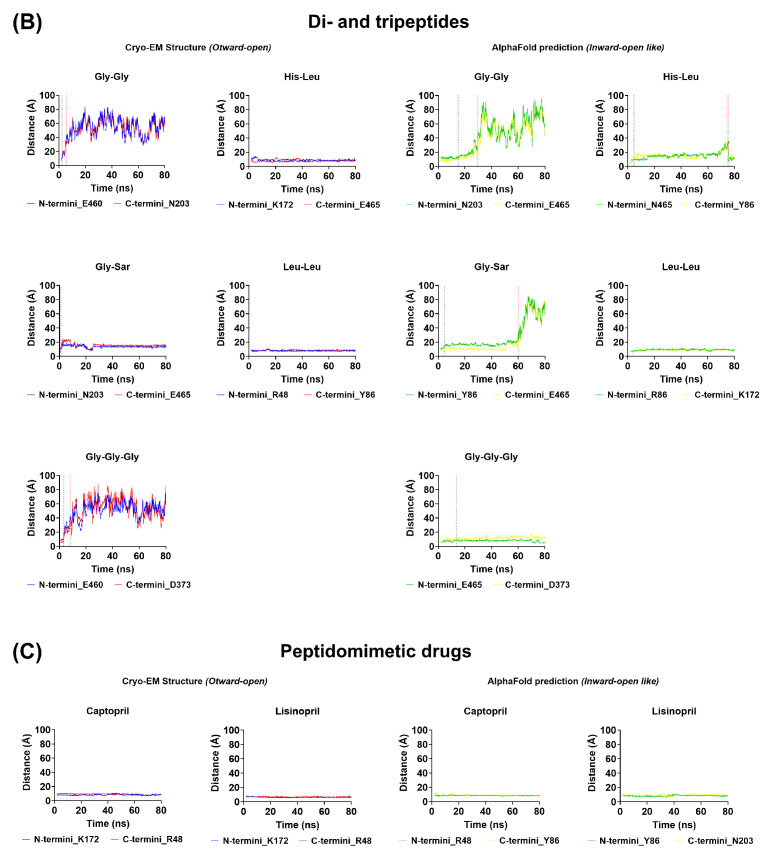
Figure 8.
Molecular Dynamics (MD) simulations. The stability of the initial docking conformation was assessed by monitoring the changes in distance between the C- and N-termini of the docked AA (A), di-tri-peptide (B) and peptidomimetic drugs (C) and the indicated AA residues present in the PHT1 binding site. The dotted lines indicate the time point at which the molecules exited their initial docking binding site (black dotted line) or the entire protein structure (red dotted lines). The distances measured over the simulation time with molecules docked to the PHT1 cryo-EM structure are colored red (N-termini) or blue (C-termini), while for the molecules docked to the AlphaFold predicted structure are colored green (N-termini) or yellow (C-termini).


