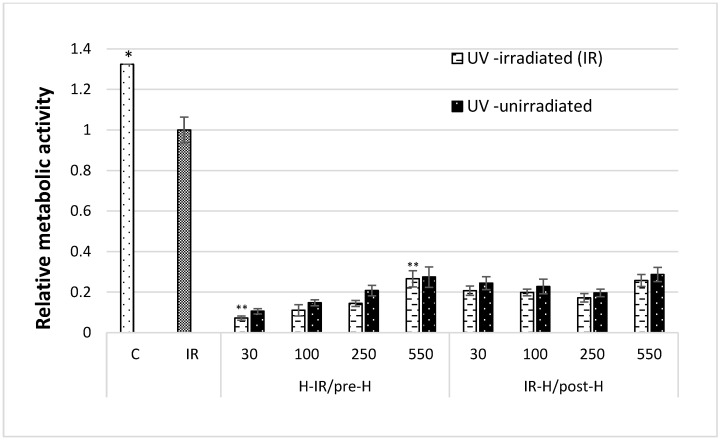
Figure 2.
The metabolic rate of fibroblasts in the presence of different content of MGO in Manuka honey. C: cells cultivated in standard conditions without UV exposure, control. IR: cells cultivated in standard conditions were exposed to UV radiation. H-IR: cells were pre-treated with Manuka honey for 24 h and then exposed to UV irradiation. IR-H: cells exposed to UV irradiation and then post-treated with Manuka honey for 24 h. Two groups of cells were treated with honey in the same way but not irradiated with UV, i.e., the pre-treated (pre-H) group and the post-treated (post-H) group. All data represent the result of three different experiments (mean ± SEM). * Tested groups compared with group C (p < 0.05). ** H-IR 30 compared with H-IR 550 (p < 0.05).

