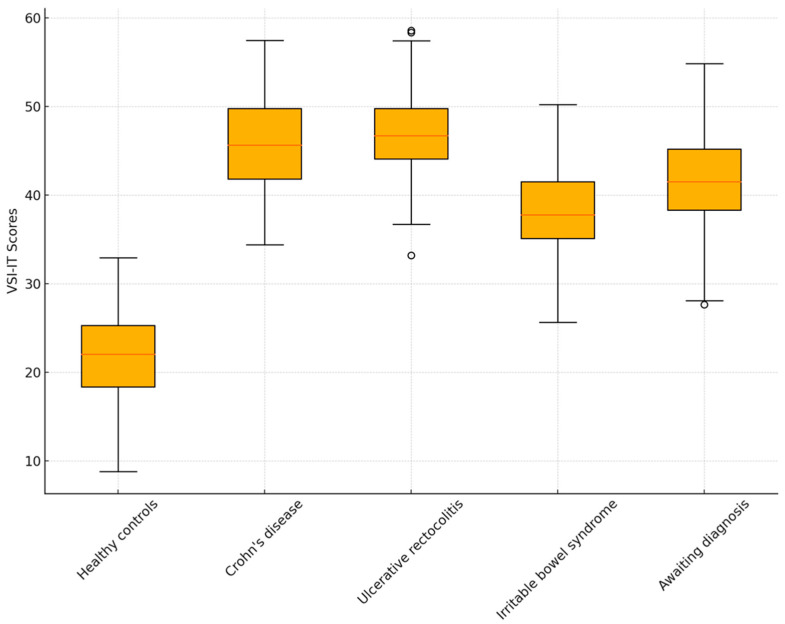
Figure 1.
Boxplot VSI-IT between groups. Legend: The x-axis represents the total VSI-IT score (range 0–75); the y-axis represents the comparison groups, divided according to diagnosis (healthy controls; Crohn’s disease; ulcerative colitis; irritable bowel syndrome; subject awaiting for a formal diagnosis).

