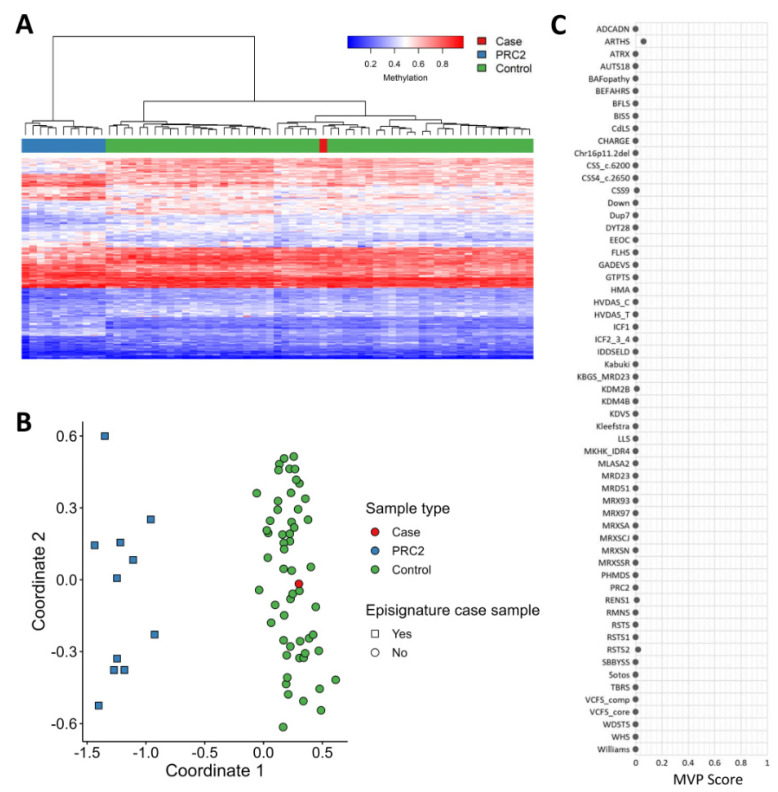
Figure 7.
EpiSign (DNA methylation) analysis of peripheral blood from a patient with a truncating FBRSL1 variant. (A) Hierarchical clustering and (B) multidimensional scaling plots indicate the patient (red) has a DNA methylation signature similar to controls (green) and distinct from cases with the PRC2 episignature (blue). (C) MVP score, a multi-class supervised classification system capable of discerning between multiple episignatures by generating a probability score for each episignature. The lack of elevated scores indicated the patient was similar to controls for all episignatures evaluated.

