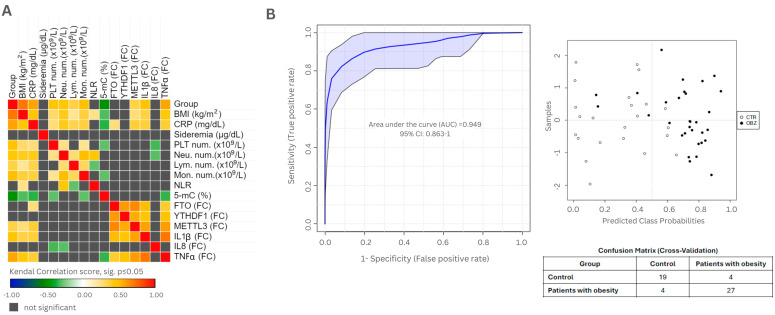
Figure 4.
(A) Heat map representing the correlations between clinical and genetic parameters (Figure was generated with Morpheus, https://software.broadinstitute.org/morpheus (accessed on 14 June 2024)). (B) ROC analysis depicting the correlation between global DNA methylation and CRP level. Obesity group (OBZ, n = 31) in comparison to healthy donors (CTR, n = 23). PLTs = platelets; Neu. num.—neutrophil number; Lym. num.—lymphocyte number; Mon. num.—monocyte number; NLR—neutrophil-to-lymphocyte ratio; 5-mC—5 methyl-cytosine; FTO (FC)—FTO fold change; YTHDF1 (FC)—YTHDF1 fold change; METTL3 (FC)—METTL3 fold change; IL1β (FC)—IL1β fold change; IL8 (FC)—IL8 fold change; TNFα (FC)—TNFα fold change; AUC—area under the curve.

