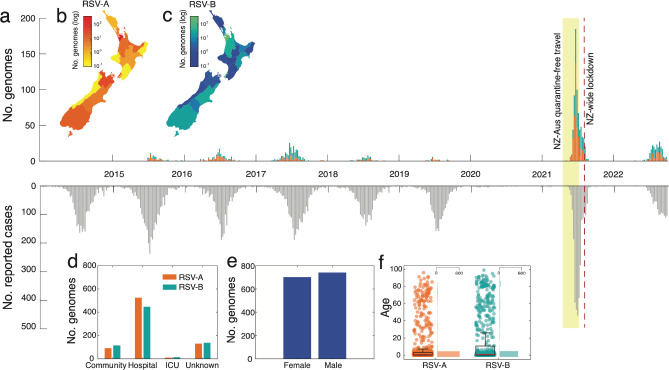
Figure 1.
(a) Number of RSV-A (orange) and RSV-B (green) genomes generated over time based on sample collection date. The reflected grey bars below show the number of reported RSV positive cases in New Zealand over the same timeframe46. (b-c) Map of New Zealand, coloured by the number of positive RSV-A and -B cases in each District Health Board. (d) The number of RSV genomes generated from cases reported in the community, hospital, intensive care unit (ICU), and those from unknown sources. (e) The number of RSV genomes generated from female and male patients. (f) The age distribution of patients from which RSV genomes were generated. A box plot indicates the mean (red), lower and upper quartiles (black), and the scatter points show the raw data. An adjacent vertical histogram shows the frequency of patient ages for RSV-A and RSV-B.

