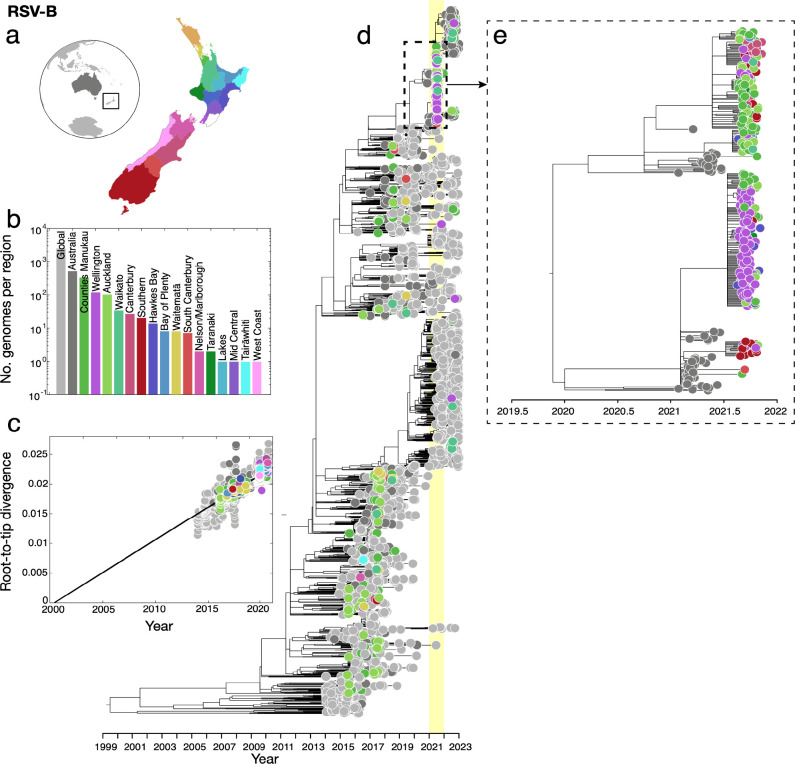
Figure 3.
(a) Map of New Zealand (where regions are categorised by District Health Board (DHB)), Australia (dark grey), and the rest of the world (light grey). (b) Number of RSV-B genomes sampled per region, where colours correspond to those in (a). (c) Root-to-tip regression analysis of RSV-B genomes versus sampling time. (d) Maximum likelihood time-scaled phylogenetic tree showing 715 RSV-B genomes sampled from New Zealand (coloured circles based on DHB region), 518 RSV-B genomes sampled from Australia (dark grey) and 2,577 RSV-B genomes sampled from the rest of the world (light grey). A yellow vertical bar highlights the year 2021 and a dotted box shows the major New Zealand clade sampled. (e) Maximum likelihood time-scaled phylogenetic tree showing the major clades sampled in New Zealand during 2021 and their closest sampled genetic relatives.

