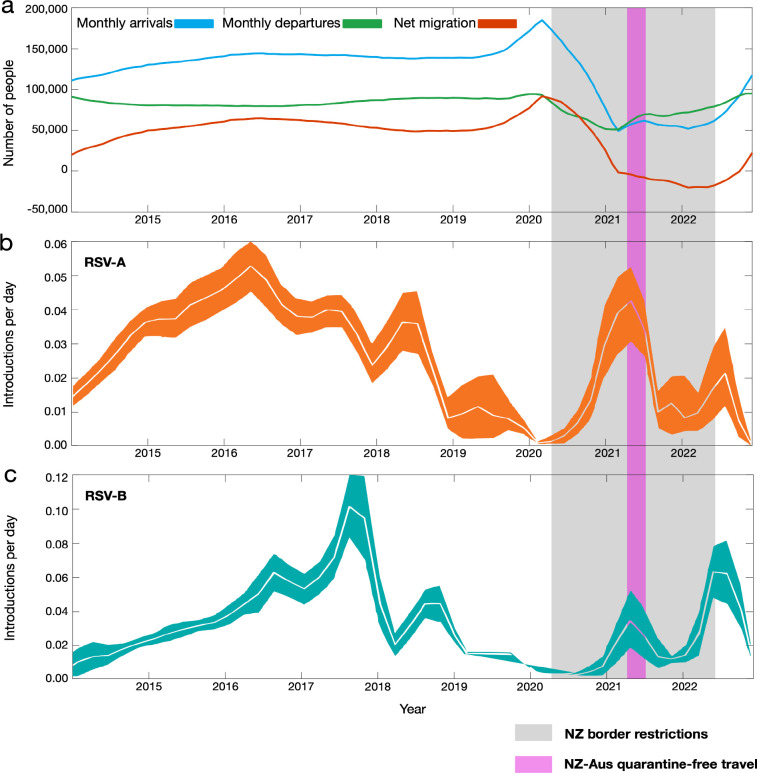
Figure 4.
(a) Number of people arriving into New Zealand (blue), number of people departing New Zealand (green) and the overall net migration of people into New Zealand (red). (b-c) Estimated migration rates of RSV-A and-B into New Zealand over time (mean estimates are shown in white and 95% credible intervals are coloured). A grey shaded area shows the period in which New Zealand underwent border restrictions during the COVID-19 pandemic. A purple shaded area shows the quarantine-free travel period with Australia.

