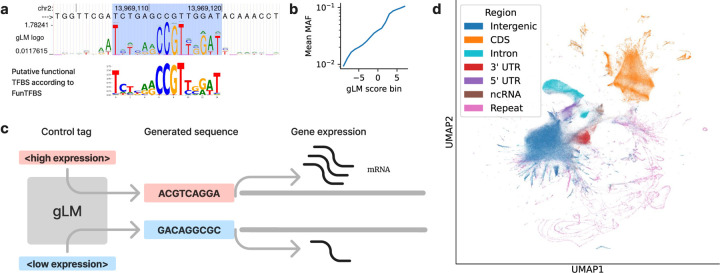
Figure 2: Application examples.
(a) gLM predicted logo plot (top) at a promoter, highlighting a motif (bottom logo) that matches a putative functional TFBS. (b) Correlation between variant minor allele frequency (MAF) and gLM score (log-likelihood ratio). (c) A gLM can be prompted with different control tags to design promoter sequences driving high or low expression in a given cell type. (d) Visualization of gLM embeddings for different classes of genomic windows, illustrating that the learned representations contain useful information such as gene regions. Note: Panels a,b,d were generated using the GPN model.

