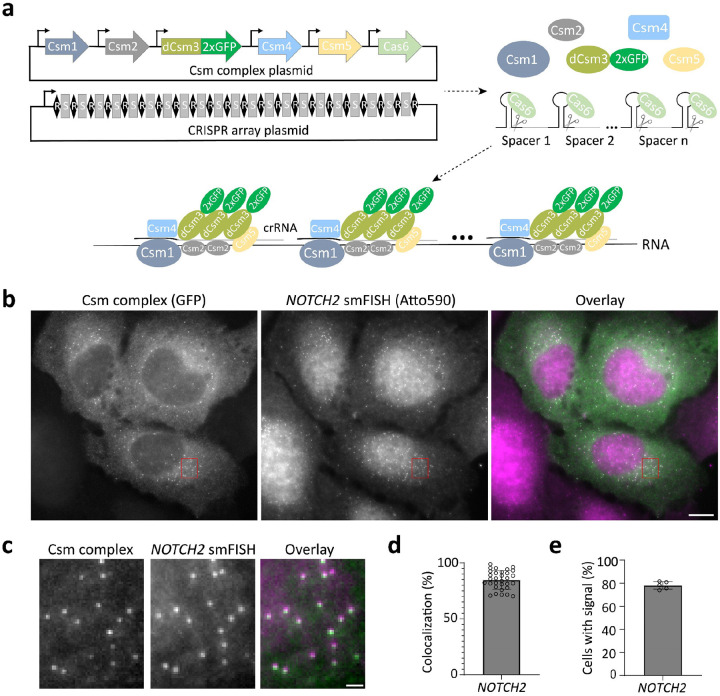
Fig. 1: Imaging native single mRNA molecules with smLiveFISH.
a, Schematic of the smLiveFISH system using multiplexed guides against a target RNA to achieve single-molecule resolution. Upon transfection with Csm and CRISPR array plasmids, cells produce Csm1, Csm2, dCsm3–2xGFP, Csm4, Csm5, and Cas6 proteins along with the pre-crRNA array. Cas6 processes the pre-crRNA array into individual crRNAs that assemble with Csm proteins into RNPs. RNPs, each with their own crRNA spacer, bind target RNA molecules simultaneously via base-pair complementarity, allowing RNA detection at single-molecule resolution. b, Fixed-cell image of individual NOTCH2 mRNAs labeled by GFP-tagged Csm complex and 48 NOTCH2-targeting spacers (left), image of individual NOTCH2 mRNAs labeled by smFISH probes (middle), and their overlay (right). Scale bar, 10 μm. c, Enlarged view of the red boxed region in b. Scale bar, 1 μm. d, Percent colocalization of Csm complex foci and smFISH foci (measured as Csm complex foci colocalized with smFISH foci divided by Csm complex foci per cell). Error bar indicates mean ± s.d., each dot represents one cell, n=31 cells. e, Percentage of transfected cells with Csm-complex-labeled foci. Images obtained from five randomly selected 7×7 tiling regions from three biological replicates (n=275 cells). Error bar indicates mean ± s.d., each dot represents one 7×7 tiling region.

