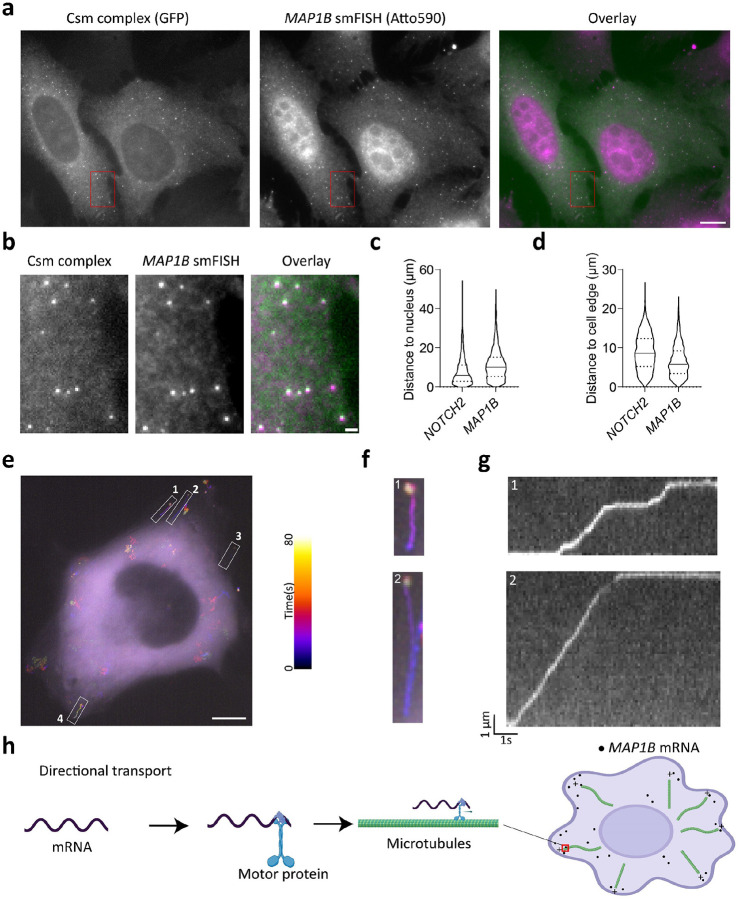
Fig. 3: Dynamics of individual MAP1B mRNAs in live cells.
a, Fixed-cell image of individual MAP1B mRNAs labeled by GFP-tagged Csm complex and 48 MAP1B-targeting spacers (left), image of individual MAP1B mRNAs labeled by smFISH probes (middle), and their overlay (right). Scale bar, 10 μm. b, Enlarged view of the red boxed region in a. Scale bar, 1 μm. c, Violin plot showing distance to the nucleus from individual NOTCH2 or MAP1B mRNA molecules. Median indicated by solid line; quartiles indicated by dashed lines. d, Same as c, but showing distance to cell edge. e, Temporal-color coded trajectory of MAP1B mRNA in live U2OS cell. Scale bar, 10 μm. White boxed regions indicate 4 directional transport MAP1B mRNA molecules f, Enlarged views of the white boxed regions 1 and 2 in e. Full movie shown in Supplementary Movie 2. g. Kymograph of boxed regions 1 and 2 in e showing the directed movement of the indicated MAP1B mRNAs. h, A proposed directional transport mechanism directing MAP1B mRNA to cell periphery based on motor protein trafficking along microtubules.

