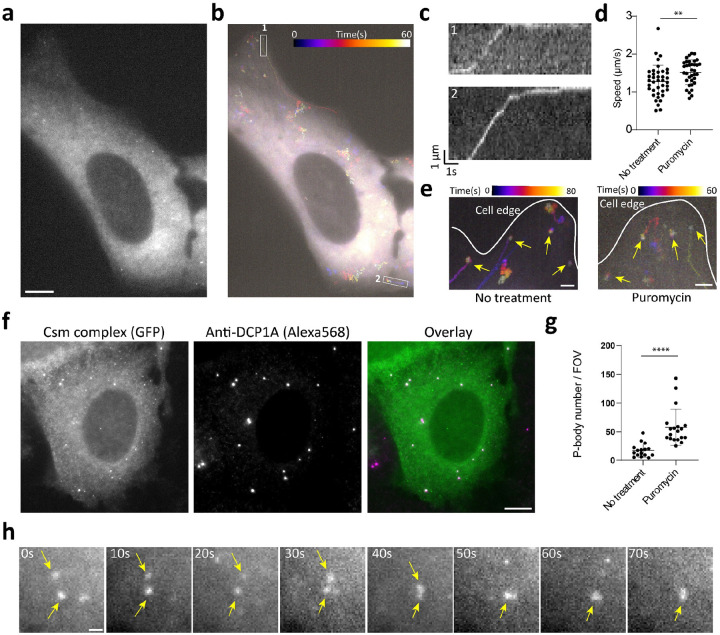
Fig. 4: Dynamics of individual MAP1B mRNAs after puromycin treatment in live cells.
a, Single snapshot of individual MAP1B mRNAs in live U2OS cell treated with puromycin. Scale bar, 10 μm. b, Temporal-color coded trajectory of MAP1B mRNA in cell shown in a. c, Kymograph of boxed regions 1 and 2 in b showing the directed movement of the indicated MAP1B mRNAs. Full movie shown in Supplementary Movie 3. d, Directed movement speeds of MAP1B mRNAs under untreated (n=39 events) and puromycin-treated (n=35 events) conditions. Each dot represents a directed movement event. **p < 0.01, t-test. e, Temporal-color coded trajectory of MAP1B mRNA at cell edge. Yellow arrows mark stationary MAP1B RNAs at the cell edge. Scale bar, 2 μm. f, Fixed-cell image of MAP1B mRNAs labeled by GFP-tagged Csm complex after puromycin treatment (left), immunostaining for the P-body marker DCP1A (middle), and their overlay (right). Scale bar, 10 μm. g, Quantification of P-body number with or without puromycin treatment. In both conditions, cells are seeded at the same density; each dot represents P-body number per field of view (FOV) with the same area. ****p < 0.0001, t-test. h, Time-lapse micrographs of MAP1B RNA granule formation after puromycin treatment in live U2OS cell. Yellow arrows mark two small puncta fusing into one larger RNA granule. Full movie is shown in Supplementary Movie 4. Scale bar, 1μm.

