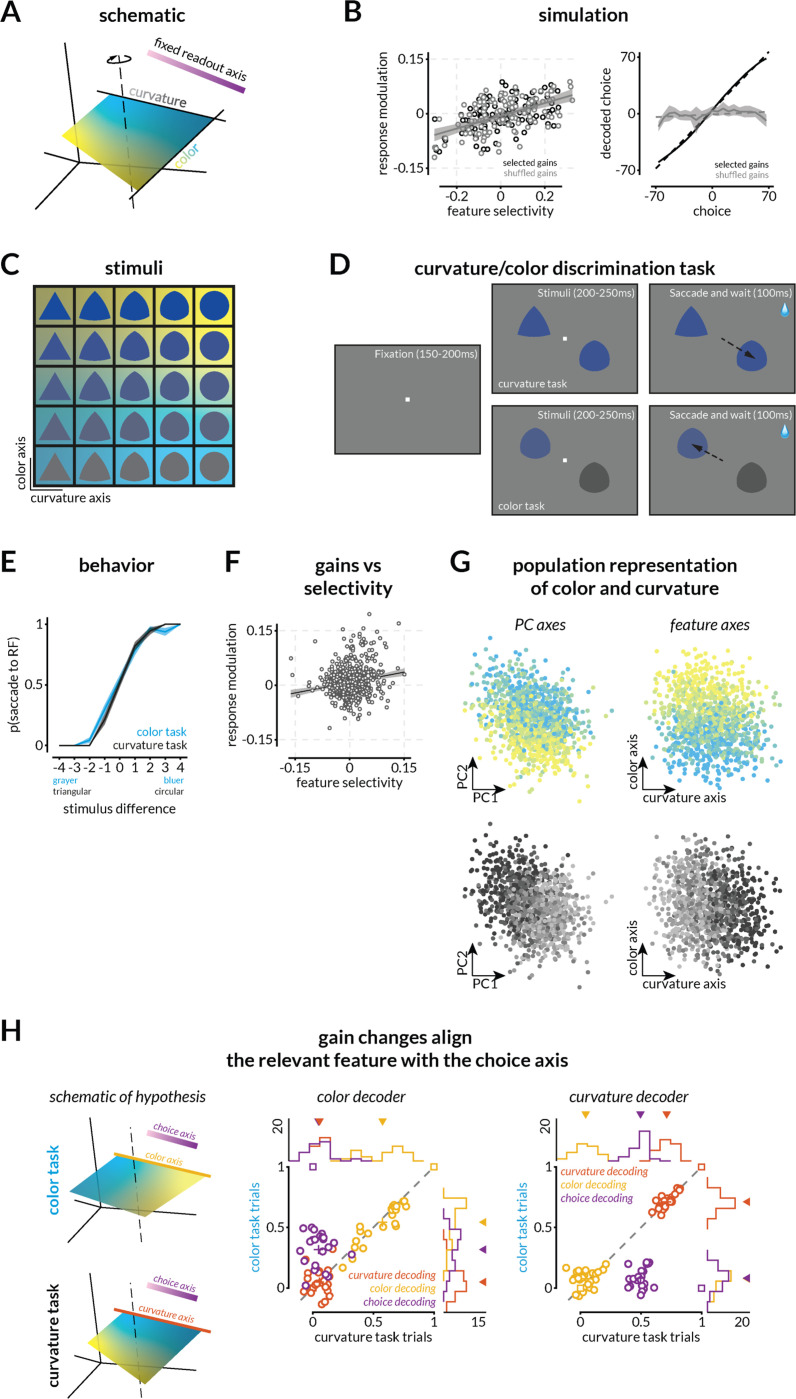
Figure 4: Small gain changes consistent with feature attention or surround modulation enable different visual features to guide choices.
A. Schematic of the hypothesis that gain changes will reformat stimulus representations to align with a fixed readout axis depending upon the relevant feature.
B. Small gain changes can, but do not necessarily transform the population response to enable different features to guide choices. Similar to Figure 3, we simulated neurons tuned to two features and assigned small gains to each neuron by drawing from a distribution similar to the distribution of gains that have been reported for feature attention(22). Some random draws transform the population such that the representation of the task-relevant feature is aligned with the readout axis (black). As in the previous simulation, many random draws from the same distributions (black vs gray points; left) do not (gray; right).
C. Stimuli varied in color/luminance (blue to gray) and curviness/shape (triangle to circle). Background colors allow comparison to neural results in G and H.
D. Schematic of the two-feature (curvature/color) discrimination task. The monkey was rewarded for making a saccade to one of the stimuli (one in the joint receptive fields of the recorded V4 neurons and one in the opposite hemifield). During the curvature task, the colors of the two stimuli were the same (selected from the same row in C) and the more circular stimulus was rewarded. During the color task, the stimuli were the same (selected from the same column in C) and the bluer stimulus was rewarded.
E. Example psychometric curves for the curvature (black) and color (blue) task. The plot depicts the proportion of trials in which the monkey chose the stimulus in the receptive fields of the recorded V4 neurons as a function of the relevant feature of the stimulus that was in that receptive field. These data are from a single experimental session (314 total trials, 89% correct overall; 176 color task trials, 89% correct; 138 shape task trials, 90% correct). Across the 23 sessions that were used for further analysis, during which curvature and color task trials were randomly interleaved, the monkey performed at 85.45% correct overall (~ 610 trials on average per session), 79.54% on the color task, and 91.65% on the shape task.
F. Replication of previous results showing a relationship between the modulation of neural responses associated with the different tasks and the selectivity of the neuron to the two features. The linear fit (R2=0.032; intercept=0.007 (p<10−11); slope=0.19 (p<10−8)) and 95% confidence intervals are indicated by black line and gray shaded region.
G. Population representation of the two stimulus features using PCA (left) and QR decomposition (right) to visualize the representations of color (blue to yellow gradient) and shape (black to gray gradient) of the image in the population RF. Each point is the V4 population response on one trial.
H. Evidence that task-dependent gains reformat neural representations to enable flexibility in which feature guides choices (left). The middle and right plots depict correlations between the values predicted by the linear combination of V4 responses that best predicts color (left) or curvature (right) and the actual values of shapes, colors, and choices in the color (y-axes) or curvature task trials (x-axes). Across both tasks, shape and color are decoded well on the shape and color axes respectively, but not vice versa, suggesting that the two features are approximately orthogonally represented in neural population space. As predicted by the simulations (square markers), on color task trials, we could decode the animal’s choices significantly better on the color than on the shape axis (Wilcoxon signed rank test, p<10−4), and on shape trials, we could decode choices significantly better on the shape than the color axis (Wilcoxon signed rank test, p<10−4). Marginal histograms with arrows indicating means are shown at the top and right of both panels (black line and the number indicate the experiment count).

