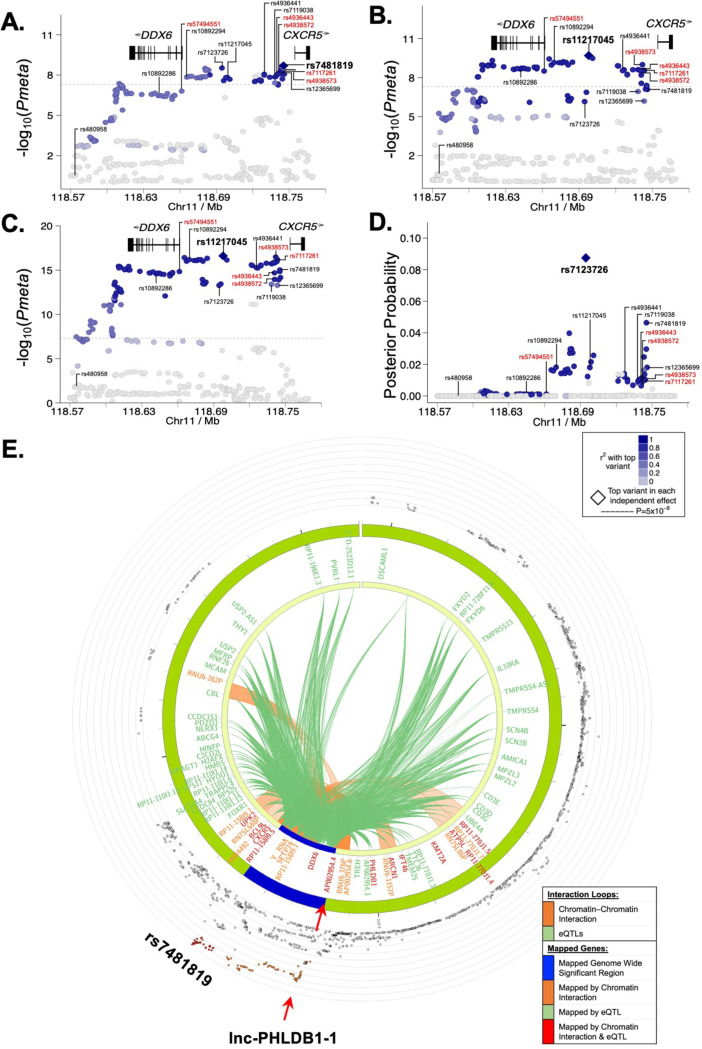
Figure 2. Fine mapping of the DDX6-CXCR5 region in Sjögren’s disease (SjD) and systemic lupus erythematosus (SLE) after imputation and meta-analysis.
(A-C) Logistic regression analysis was performed on (A) Dataset 1 (DS1)-SjD (3851 SjD cases; 23652 controls), (B) DS2-SLE (11840 SLE cases; 28869), and (C) DS1+DS2 (merged SjD and SLE) after quality control and imputation, identifying the top SNPs (e.g., index SNPs indicated in bold) of the DDX6-CXCR5 region. (D) Posterior probability distribution of SNPs in the DDX6-CXCR5 region of DS1-SjD, identifying rs7123726 as having the highest posterior probability. For A-D, SNPs prioritized for bioinformatic screening are indicated in black; five SNPs prioritized for functional characterization are labeled in red. (E) Circos plot showing chromatin-chromatin interactions in GM12878 EBV B cell line (orange) and reported eQTLs from different cells/tissues (green). The outer ring shows the logistic regression analysis of DS1-SjD with index SNP rs7481819 indicated.

