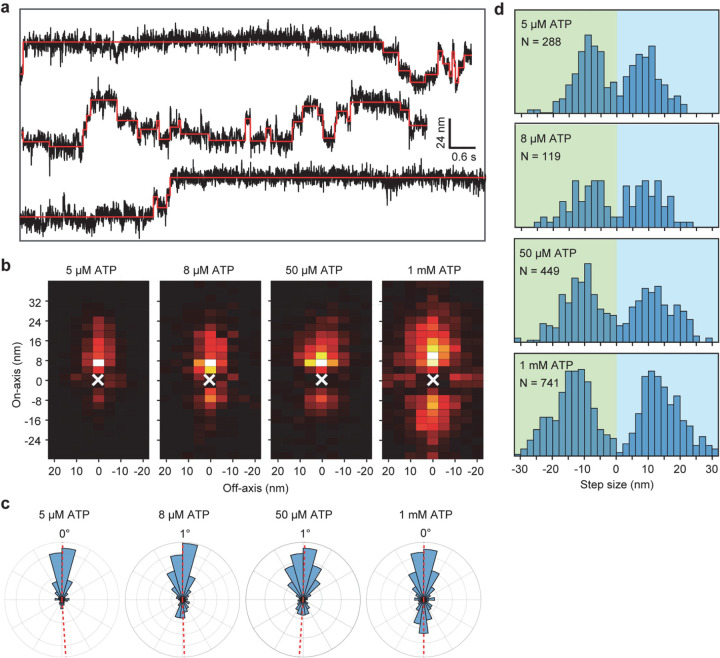
Extended Data Figure 5 |. Two-dimensional step analysis of MINFLUX trajectories.
a, Additional example trajectories of dynein stepping along the MT off-axis at 20 µM ATP. b, Heat maps of two-dimensional stepping of dynein at different ATP conditions. c, Polar histograms of dynein’s stepping direction reveal the mean angular deviation of dynein from the MT minus-end. d, The histogram of steps taken by dynein in the off-axis direction under different ATP concentrations.

