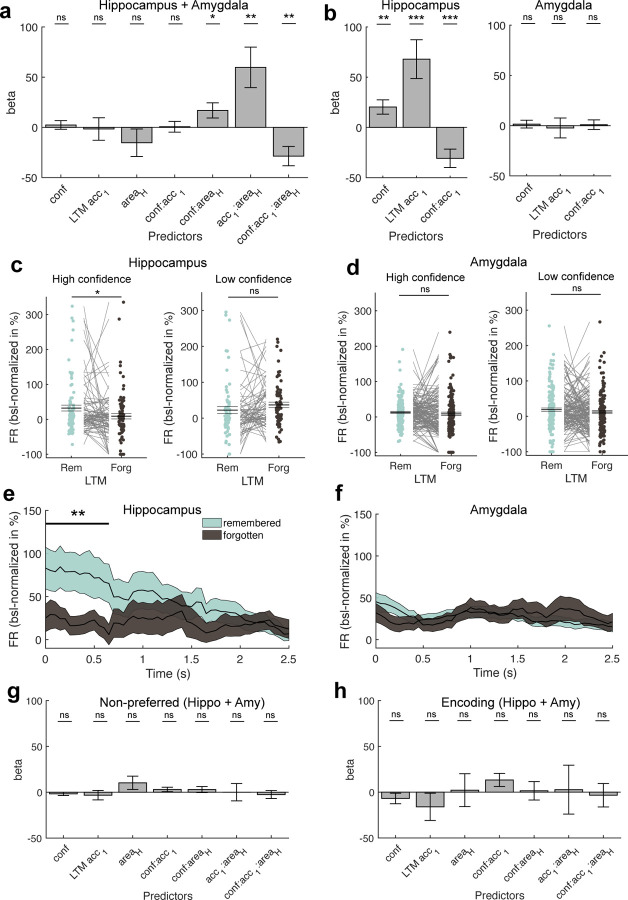
Figure 3. Relationship between WM maintenance activity and LTM formation.
(a) Mixed-effects model using the FR obtained during the WM maintenance period in correct and preferred trials of all category cells across both regions, modelling confidence, subsequent LTM accuracy (remembered vs forgotten), area, and their interactions as fixed effects and neuron ID nested into patient ID as random intercepts. We found significant modulations of FR by interactions of confidence and LTM accuracy with area, suggesting differences in FR modulations by LTM accuracy and confidence per area. (b) Mixed-effects GLM results separately for the hippocampus (left) and the amygdala (right). Only in the hippocampus, we observed that persistent activity during the WM maintenance period predicted later LTM accuracy as well as confidence. (c,d) Comparison of FRs during the maintenance period between later remembered and forgotten images, separately for high (left) and low confidence trials (right) for category neurons from (c) the hippocampus and (d) the amygdala. Statistics are permutation-based t-tests, each dot is a neuron. FRs differed significantly between remembered and forgotten images in the hippocampus for high but not low confidence trials. (e,f) Time-resolved FR differences between later high-confident remembered and forgotten trials in (e) the hippocampus and (f) the amygdala for the maintenance period. FR differences between remembered and forgotten trials in the hippocampus were strongest in the first section of the WM delay period (0 – 650 ms). Cluster-based permutation t-test. Colored areas represent ± s.e.m. t=0 marks the onset of the maintenance period. (g) Mixed-effects model results using the WM maintenance period FRs of non-preferred trials across all category neurons from both regions. (h) Mixed-effects model results using the FRs during the first picture presentation (encoding 1; 0–2 s after picture onset; preferred images and correct trials only) across all category neurons from both regions. In (a,b,g,h) error bars represent standard errors of the coefficients. Betas are shown in units of baseline-normalized FRs (percent change to baseline, −900 – −300 ms before first picture onset). In (c,d) center lines represent mean ± s.e.m. * p < 0.05, ** p < 0.01, *** p < 0.001, ns = not significant.

