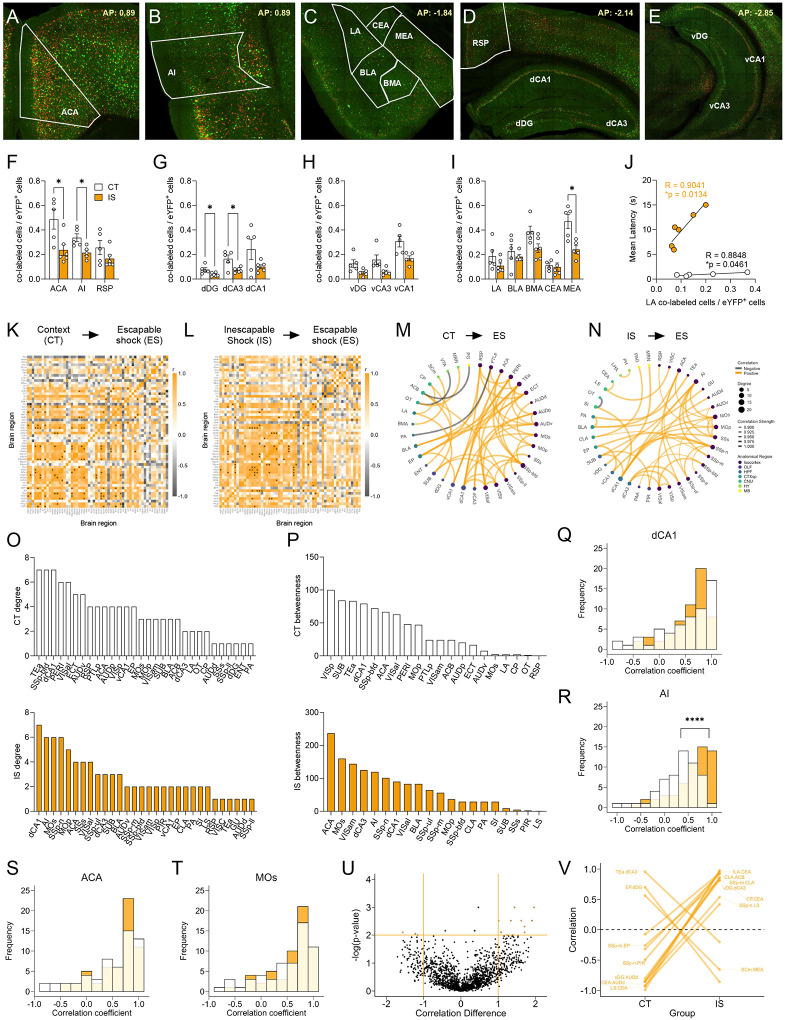
Fig 5. Network analysis of reactivated inescapable shock ensembles during learned helplessness reveals altered functional connectivity.
(A-E) Representative images of regions identified for targeted analysis, including isocortical regions (anterior cingulate area, ACA; agranular insula, AI; retrosplenial area, RSP), dorsal hippocampal regions (dorsal dentate gyrus, dDG; dorsal CA3, dCA3; and dorsal CA1, dCA1), ventral hippocampal regions (ventral dentate gyrus, vDG; ventral CA3, vCA3; and ventral CA1, vCA1), and amygdalar areas (lateral amygdalar nucleus, LA; basolateral amygdalar nucleus, BLA; basomedial amygdalar nucleus, BMA; central amygdalar nucleus, CEA; medial amygdalar nucleus, MEA). Representative region overlays were manually drawn. (F-I) The ACA, AI, dDG, dCA3, and MEA show significantly decreased reactivation activity (co-labeled cells / eYFP+ cells) in the mice exposed to inescapable shock compared to context training. (J) LA reactivation activity in both context trained (CT) and inescapable shock (IS) mice shows positive correlation to escape latency. (K-L) Cross regional correlation heatmaps of reactivation activity in CT and IS mice. (M-N) Functional networks constructed after thresholding for the strongest and most significant correlated or anti-correlated connections (r > 0.9, p < 0.01). (O) Top individual node degree values in descending for the CT (white, top) and IS (yellow, bottom) networks. (P) Highest node betweenness values in descending for the CT (white, top) and IS (yellow, bottom) networks. (P) Volcano plot and parallel coordinate plots highlighting the permuted correlation differences (rIS – rCT) of functional connections of reactivated activity showing the greatest change (|correlation difference| > 1), and are most significant (p < 0.01) between the CT and IS groups. **p < .01, ****p < .0001. Error bars represent ± SEM.

