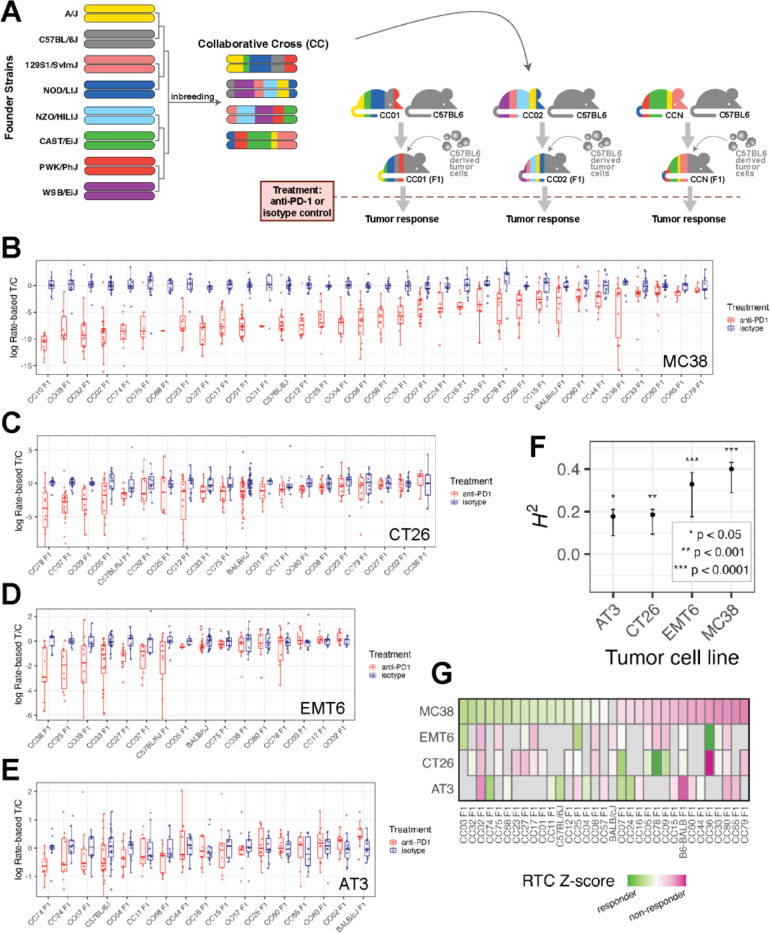
Figure 1: A system for quantifying ICI response across variable host genetics and its application to four implantable tumor models.
(A) Schematic overview of our mouse CC-based system for measuring ICI response in diverse but replicable genetic backgrounds using a tumor with fixed genetic background. (B-E) Boxplots showing our measure of ICI response, the per-mouse rate-based tumor/control (RTC) computed across strains implanted with each tumor cell line model. Blue points and boxes display RTC for isotype control mice which are approximately centered at zero for all strains, while red points/boxes display values for aPD1-treated mice. A large difference between red and blue boxes for a particular strain would indicate a strong response to ICI. (F) Significant broad-sense heritability (H2) of ICI response was seen for each implantable tumor cell line model, computed using data from all CCF1 lines profiled with that model. (G) Heatmap of median log(RTC) values standardized across each tumor model and plotted across all strains profiled in at least two tumor models show differential impact of the CCF1 crosses on aPD1 response depending on the tumor model used.

