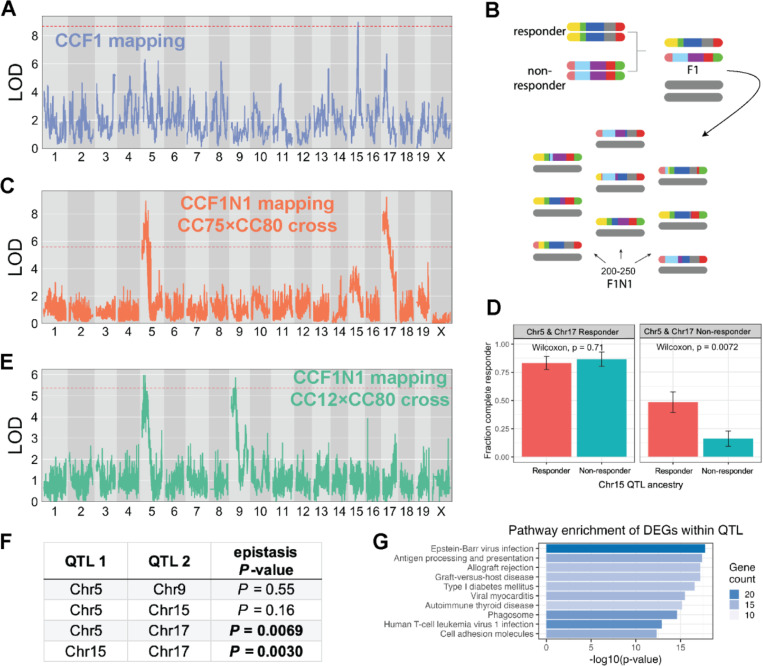
Figure 2: Discovery of ICI response QTL and their epistatic interactions.
(A) LOD curve for a genome scan of ICI response in CCF1 lines using the MC38 tumor model. (B) Schematic outlining breeding design to generate a mapping population for CCF1N1 studies. (C) LOD curve for a genome scan of ICI response in CCF1N1 (CC75×CC80) mice using the MC38 tumor model. (D) Illustration of epistatic interactions between QTL in our CCF1N1 (CC75×CC80) mapping population. Three QTL on mChr 5, 15, and 17 were polarized as responder or non-responder using haplotype effect estimates from our CCF1 mapping. The results show that the responder haplotype on Chr15 exhibited an in vivo response mainly when both the Chr5 and Chr 17 haplotypes are in the non-responder configuration. (E) LOD curve for a genome scan of ICI response in CCF1N1 (CC12×CC80) mice using the MC38 tumor model. Since the two CC lines are matched for the mChr 17 haplotype, the mChr 17 QTL is absent. (F) Table reporting results of statistical testing of epistatic interactions between QTL (see Methods). Pairs of QTL with significant evidence of interaction are shown with p-value in bold. (G) Top 10 most enriched pathways among responder vs. non-responder strain differentially expressed genes that are physically located within one of our four QTL intervals. Bar length is proportional to the -log10(p-value) for enrichment, while bar shading is proportional to the number of genes in each annotated pathway contained within our gene set (DEGs within QTL).

