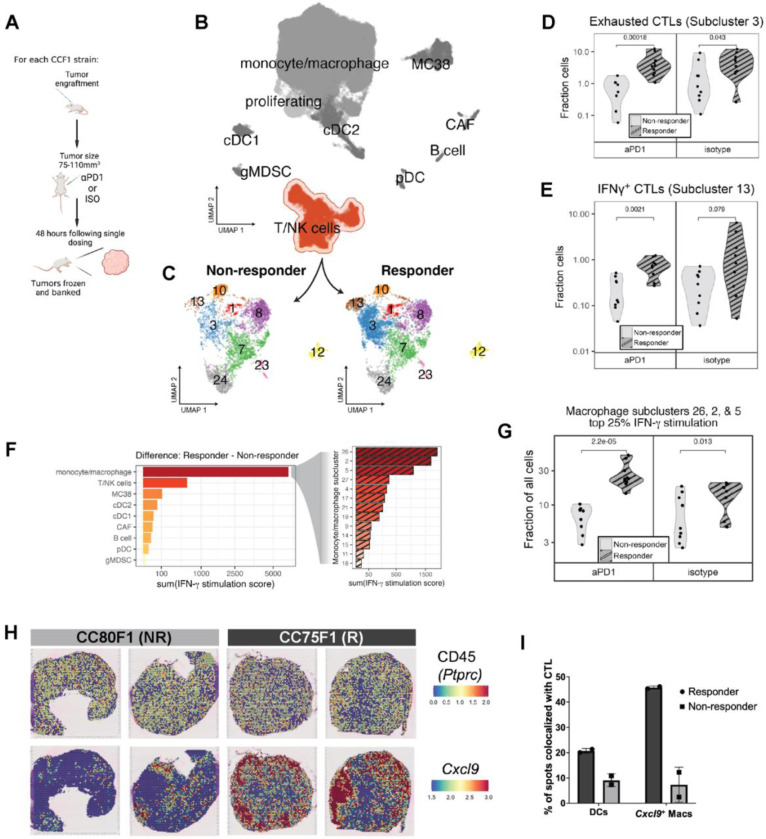
Figure 3: Immunophenotyping reveals enrichment and co-localization of CTL and IFNγ-stimulated macrophages in responder strain MC38 tumors.
(A) Overview of single dose paradigm where tumors are harvested 48 hours after a single dose of aPD1 or isotype control in order to capture the initial effects of treatment prior to macroscopic changes in size. (B) UMAP plot depicting an overview of heterogeneity in single cell transcriptomes derived from responder and non-responder strain tumors and highlighting the T/NK cell cluster. (C) Subclustering of the T/NK cell cluster reveals transcriptionally distinct cell subsets showing enrichment of subclusters 3 and 13 in responding tumors. (D) Fraction of exhausted CTLs (cluster 3) as portion of all cells in responder and non-responder strain groups. (E) Fraction of IFNγ+ CTLs (cluster 13) as portion of all cells in responder and non-responder strain groups. (F) Expression of an 18-gene signature reflecting IFNγ+ stimulation applied to all cells in each cluster (left) or macrophage subcluster (right), with bars depicting the difference in summed pathway score between responder and non-responder cells within each (sub)cluster. (G) Fraction of IFNγ stimulated macrophage clusters (clusters 2, 5, and 26) as portion of all cells in responder and non-responder strain groups. (H) Visium spatial transcriptomics images showing expression of CD45 (Ptprc) [top row] and Cxcl9 [bottom row] in spatially-resolved spots of tumors harvested from responder (CC75F1) and non-responder (CC80F1) mouse tumors. (I) Percent of spatial transcriptomics spots expressing markers indicative of DCs and Cxcl9+ macrophages that are co-localized with expression of CTL markers.

