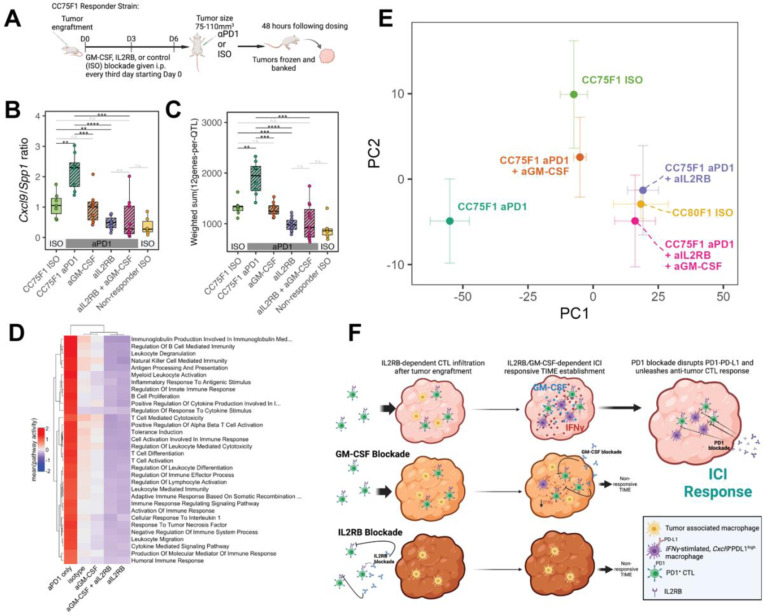
Figure 5: In vivo blockade of GM-CSF and IL2RB reverses the transcriptional signature of aPD1 response.
(A) Schematic overview of the blocking antibody dosing protocol and strategy for assessing tumors before macroscopic changes in size. (B) Cxcl9/Spp1 ratio computed using RNA-Seq gene expression profiling of CC75F1 MC38 tumors collected as in (A). (C) Transcriptional changes of our 48 TIME gene panel assessed on the same tumors as in (B). ****P < 0.0001; ***P < 0.001; **P < 0.01; *P < 0.05; n.s. – not significant (D) Heatmap of enriched immune-related pathways among the experimental groups profiled in this blocking antibody experiment showing reversal of immune signatures. Pathway activity was computed based on leading edge genes identified by gene set enrichment analysis (Methods) and constituted the mean of standardized (per-gene, across all samples) gene expression. (E) Principal component (PC) plot showing the positioning of each group of samples within the first two PCs. CC75 ISO is the tumor in a responding genetic cross treated with isotype control antibodies whereas CC80 ISO is the tumor in a non-responding genetic cross treated similarly. Principal component analysis was performed using batch-corrected RNA-Seq profiles (Methods) with error bars showing +/−1 standard error within each group. (F) Model describing the effects of IL2RB and GM-CSF blockade on the MC38 TIME and response to aPD1.

