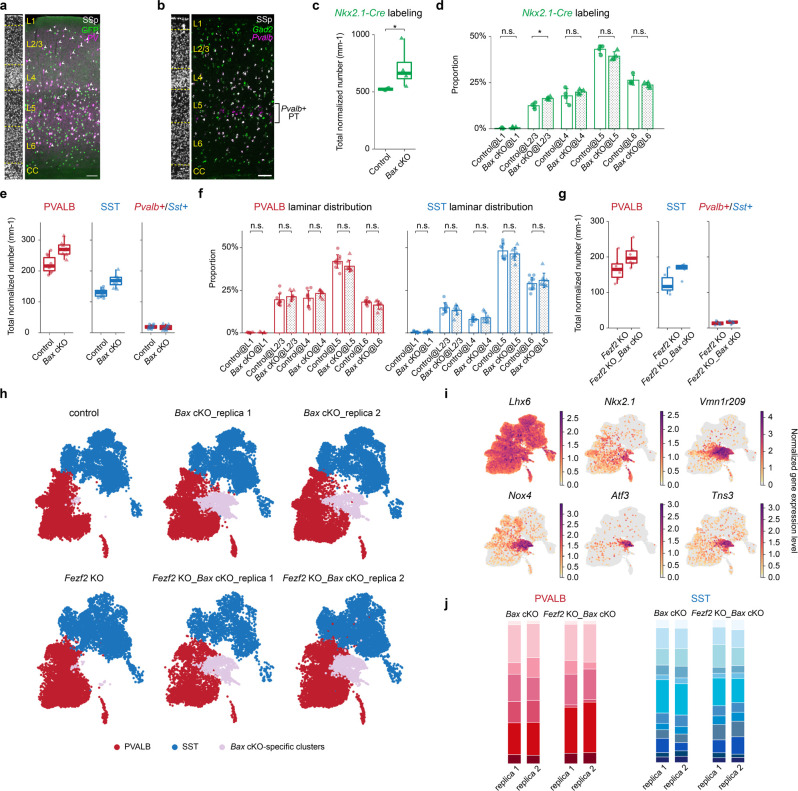
Extended Data Fig. 7. Conditional removal of Bax in PVALB and SST interneurons increases their number.
a, Representative image of coronal brain sections from a P26 Nkx2.1-Cre;Baxfl/+;Rosa26LSL-h2b-GFP mouse, immunostained against GFP and PV, illustrating the incomplete labeling of superficial PV interneurons in the SSp region. Scale bar: 100 μm. b, Representative RNAscope in situ hybridization images showing labeled Pvalb and Gad2 mRNA transcripts, highlighting the expression of Pvalb gene outside of interneurons, specifically in Gad2- L5b PT neurons in the SSp region. Scale bar: 100 μm. c, Quantification of genetically labeled interneurons by Nkx2.1-Cre;Rosa26LSL-h2b-GFP in control and Bax cKO conditions. control: n=3 mice (n=2 Bax cHET, n=2 Fezf2 HET_Bax cHET), n=2316 GFP+ interneurons counted; Bax cKO: n=4 mice (n=2 Bax cKO, n=2 Fezf2 HET_Bax cKO), n=3548 GFP+ interneurons counted. d, Laminar distribution of genetically labeled interneurons compared between control and Bax cKO conditions. Same dataset as in c. Error bars show standard deviations. e, Quantification of PVALB and SST interneurons in control and Bax cKO cortices in the SSp region, based on results from RNAscope in situ hybridization of fixed-frozen brain sections. L5 PT neurons were identified as Pvalb+/Lhx6- cells located in L5b and subsequently excluded from the quantification. Numbers are normalized to the length of the outskirts of the cortex in millimeters. control: n=10 ROIs, n=5 mice (n=1 WT, n=2 Bax cHET, n=1 Fezf2 HET_Bax cHET), age P26–28, n=3932 total PVALB interneurons, n=2280 total SST interneurons, n=337 Pvalb+/Sst+ interneurons. Bax cKO: n=8 ROIs, n=4 mice (n=2 Bax cKO, n=2 Fezf2 HET_Bax cKO), age P26–28, n=3470 total PVALB interneurons, n=2150 total SST interneurons, n=221 total Pvalb+/Sst+ interneurons quantified. f, Same dataset as in d, showing the distribution of PVALB and SST interneurons in different cortical layers was not altered in Bax cKO. Error bars show standard deviations. g. Quantification of PVALB and SST interneurons in Fezf2 KO and Fezf2 KO_Bax cKO cortices, based on RNAscope in situ hybridization of fresh-frozen sections. Fezf2 KO: n=6 ROIs, n=4 mice (n=1 Fezf2 KO, n=3 Fezf2 KO_Bax cHET), age P28–33, n=1668 total PVALB interneurons, n=1257 total SST interneurons, n=138 total Pvalb+/Sst+ interneurons quantified. Fezf2 KO_Bax cKO: n=6 ROIs, n=4 mice, age P28–33, n=2161 total PVALB interneurons, n=1768 total SST interneurons, n=175 total Pvalb+/Sst+ interneurons quantified. h, UMAP plots of P14 snRNA-seq data on interneurons from four different genotypes, showing a group of cells that are specific to the Bax cKO and Fezf2 KO_Bax cKO conditions. i, UMAP plots showing the normalized gene expression level of selected genes that are expressed in Bax cKO-specific clusters. j, Stacked bar plots showing that the proportion of different PVALB and SST interneurons remains relatively consistent across biological replicates of snRNA-seq of cortical interneurons from Bax cKO and Fezf2 KO_Bax cKO brains. d and f, Wilcoxon rank-sum test, n.s. not significant, p≥0.05; *p<0.05. Detailed p-values are provided in Supplemental Table 2.

