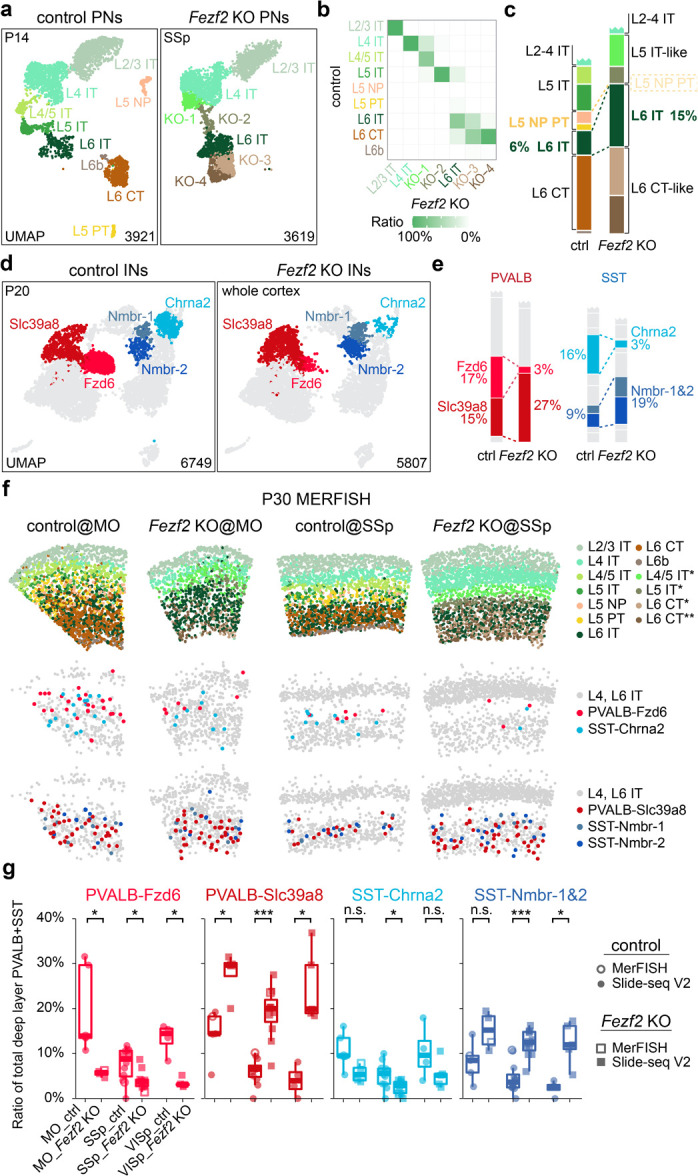
Figure 2. Fezf2 KO changes the proportion of deep-layer PVALB and SST interneuron subtypes.

a, UMAP visualization of published snRNA-seq data of excitatory neurons from P14 control (Fezf2 HET) and Fezf2 KO mouse SSp cortices30. b, Heatmap illustrating the correspondence of each PN type between control and Fezf2 KO based on transcriptomic similarity. KO-1 through KO-4 have been named as L4/5 IT*, L5 IT*, L6 CT*, and L6 CT** thereafter to reflect their mapped identity. c, Proportion of deep-layer PNs in snRNA-seq data of control and Fezf2 KO cortices. d, UMAP visualization of snRNA-seq data on cortical interneurons from P20 control (Dlx5/6-Cre;Rosa26LSL-h2b-GFP) and Fezf2 KO (Dlx5/6-Cre;Fezf2lacZ/lacZ;Rosa26LSL-h2b-GFP) mice, highlighting five deep-layer interneuron subtypes with altered proportions in the Fezf2 mutant. e, Proportion of PVALB and SST interneuron subtypes in control and Fezf2 KO cortices based on snRNA-seq data, with selected subtypes highlighted. f, MERFISH spatial map of coronal brain sections from MO and SSp cortices of P30 control and Fezf2 KO mice, illustrating the distribution of PNs and selected interneuron subtypes. g, Boxplot showing the proportion of selective PVALB and SST interneuron subtypes within all PVALB and SST interneurons found in L5/6, based on both MERFISH and Slide-seq data. MO_ctrl: n=5 ROIs (1 MERFISH), n=4 mice; MO_Fezf2 KO: n=4 ROIs (1 MERFISH), n=4 mice; SSp_ctrl: n=12 ROIs (1 MERFISH), n=8 mice (including 2 mice that are Fezf2 HET_Bax cHET); SSp_Fezf2 KO: n=11 ROIs (1 MERFISH), n=8 mice (including 2 mice that are Fezf2 KO_Bax cHET); VISp_ctrl: n=4 ROIs, n=4 mice; VISp_Fezf2 KO: n=5 ROIs, n=2 mice. Age range for all samples: 4–6 weeks (including one published Slide-seq data40: puck 200306_02). Wilcoxon rank-sum test, n.s. not significant, p≥0.05; *p<0.05; **p<0.01; ***p<0.001. Detailed p-values are provided in Supplementary Table 2.
