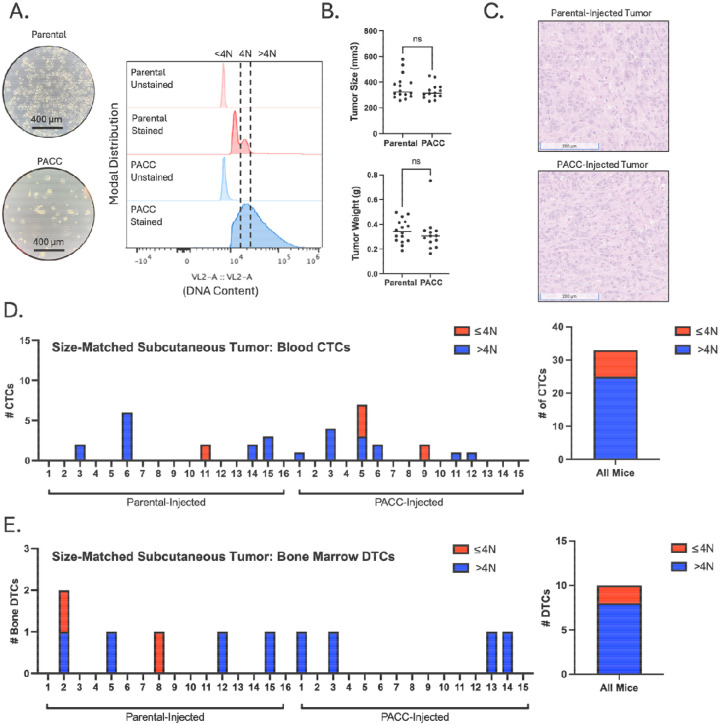
Figure 2:
Size-matched, subcutaneous injection of PC3-GFP-Luc parental population vs. PACC-enriched population: A) Light microscopy photos and flow-cytometric ploidy analysis of injected cells per injection group. B) Tumor volume and tumor weight measurements per injection group at experimental endpoint. C) Representative H&E photos of primary tumors per injection group. D) Enumeration of CTCs sourced from the blood of each animal and quantification of % >4N CTCs vs. ≤ 4N CTCs. E) Enumeration of DTCs sourced from the bone marrow of each animal and quantification of % >4N DTCs vs. ≤ 4N DTCs.

