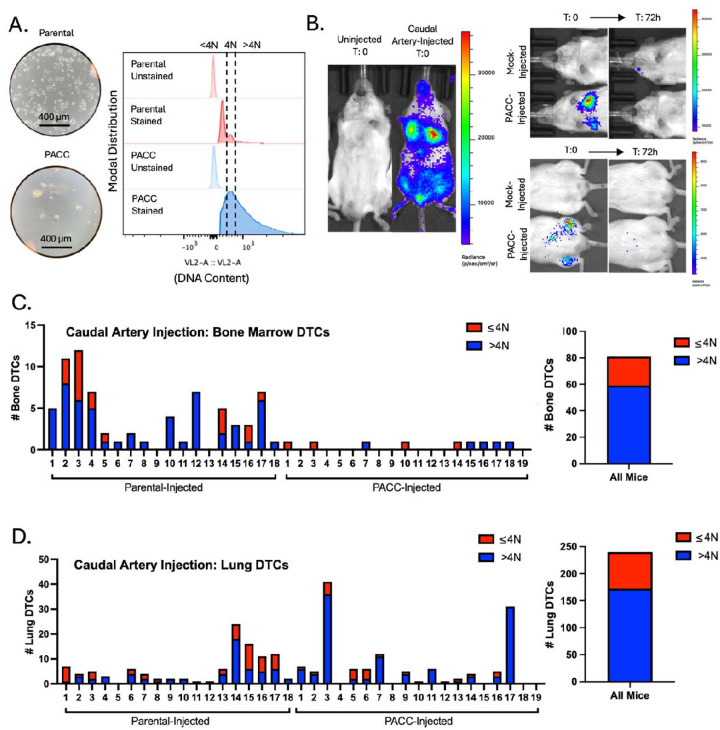
Figure 3:
Caudal Artery injection of PC3-GFP-Luc parental population vs. PACC-enriched population: A) Light microscopy photos and flow-cytometric ploidy analysis of injected cells per injection group. B) Representative BLI images capturing the cellular distribution and signal intensity immediately following caudal artery injection and 72 hours following caudal artery injection. C) Enumeration of DTCs sourced from the bone marrow of each animal and quantification of % >4N DTCs vs. ≤ 4N DTCs. E) Enumeration of DTCs sourced from the lung tissue of each animal and quantification of % >4N DTCs vs. ≤ 4N DTCs.

