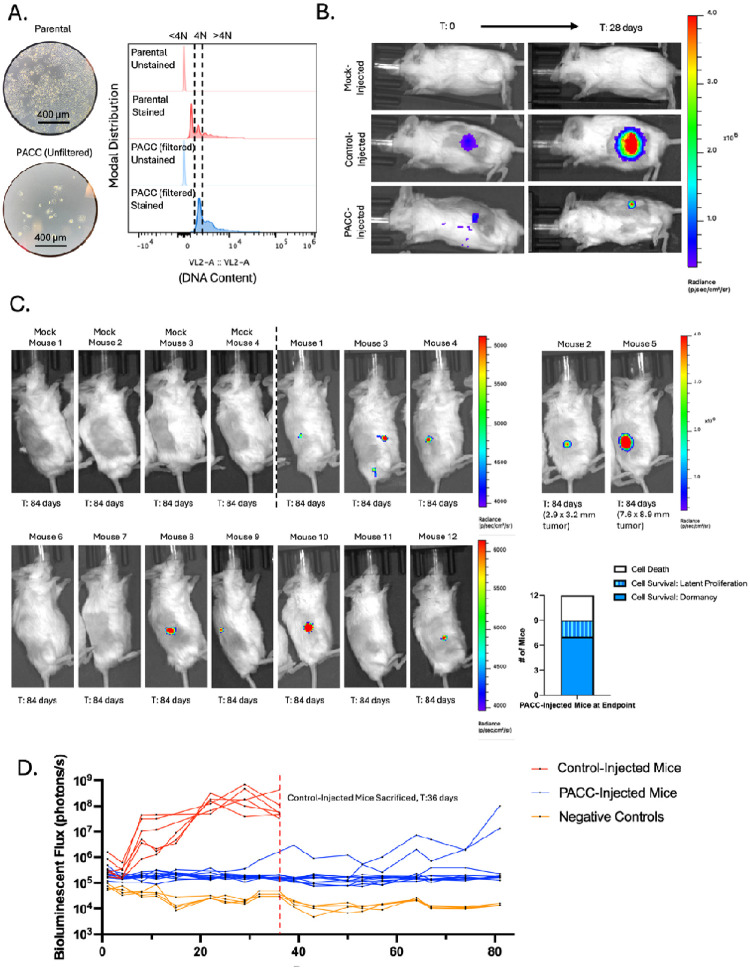
Figure 4:
Subcutaneous injection of PC3-Luc parental population vs. size filtered PACC population: A) Light microscopy photos and flow-cytometric ploidy analysis of injected cells per injection group. B) Representative BLI images capturing the cellular distribution and signal intensity immediately following subcutaneous injection and 28 days following subcutaneous injection. C) BLI images of 4 mock-injected and 12 PACC-injected mice 82 days following subcutaneous injection. Note the different scale for Mouse 2 and Mouse 5. Quantification of the status of injected cells across all 12 PACC-injected mice at experimental endpoint. D) Weekly BLI flux of all experimental mice over 84 days.

