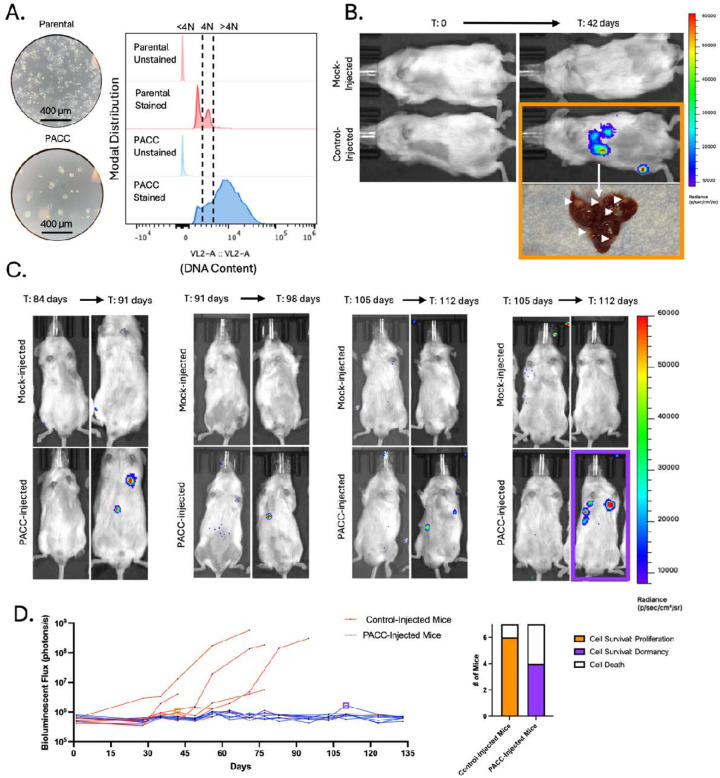
Figure 5:
Intracardiac injection of PC3-GFP-Luc parental population vs. PACC-enriched population: A) Light microscopy photos and flow-cytometric ploidy analysis of injected cells per injection group. B) Representative BLI images capturing the cellular distribution and signal intensity immediately following intracardiac injection and 42 days following intracardiac injection. C) BLI images of 4 mock-injected and 4/7 PACC-injected mice that showed evidence of colonization following dormancy between 91- and 112-days post intracardiac injection. D) Weekly BLI flux of all experimental mice over 135 days. Quantification of the status of injected cells across all 7 PACC-injected mice at experimental endpoint.

