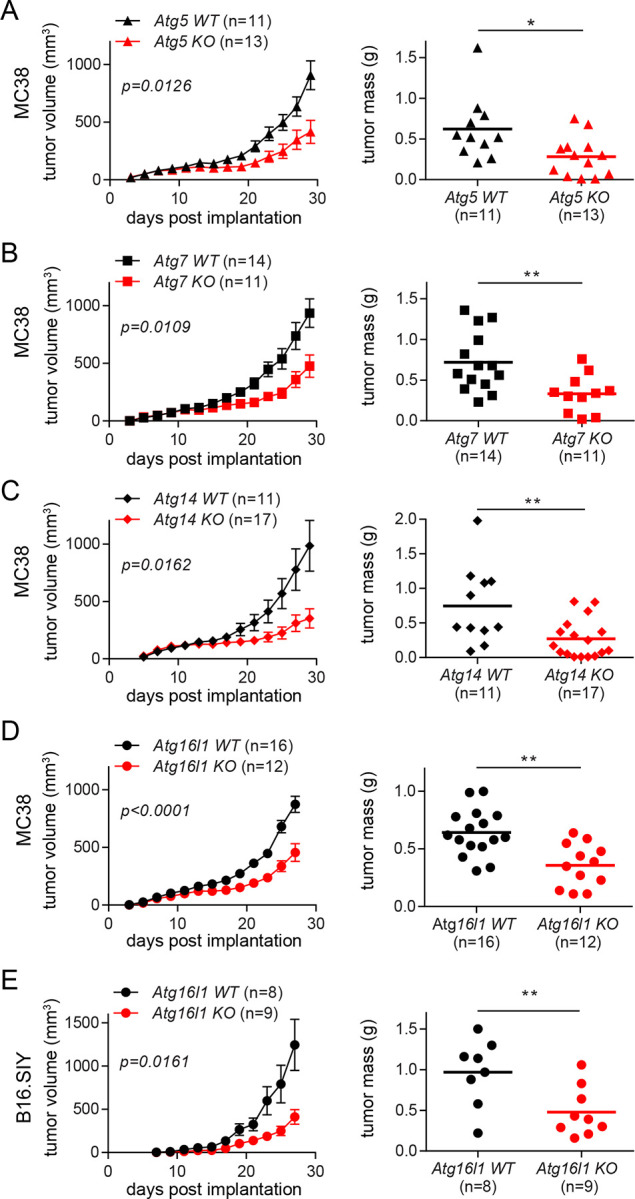
Figure 1. Autophagy deficiency in myeloid cells suppresses the growth of implanted tumors.

(A-D) Tumor growth and tumor mass in mice with various autophagy genes deleted myeloid cells. 1×10⁵ MC38 cells were subcutaneously injected onto female mice. Tumor volumes on the left panel were measured every 2 days. At the end point, tumors were collected, and the weights were measured as shown on the right panel. Total number of mice used for each study (n) are indicated in each figure, and each data point in tumor mass represents each mouse. The p values for tumor volumes were calculated with two-way ANOVA, and the statistical significance for tumor mass were calculated with Mann-Whitney test. *p < 0.05, **p < 0.01. (A) Atg5 WT is Atg5flox/flox and Atg5 KO is Atg5flox/flox+LysMcre. (B) Atg7 WT is Atg7flox/flox and Atg7 KO is Atg7flox/flox+LysMcre. (C) Atg14 WT is Atg14flox/flox and Atg14 KO is Atg14flox/flox+LysMcre. (D) Atg16l1 WT is Atg16l1flox/flox and Atg16l1 KO is Atg16l1flox/flox+LysMcre. (E) 1×10⁵ B16.SIY cells were subcutaneously injected onto female mice, and the same analysis as described above were performed.
