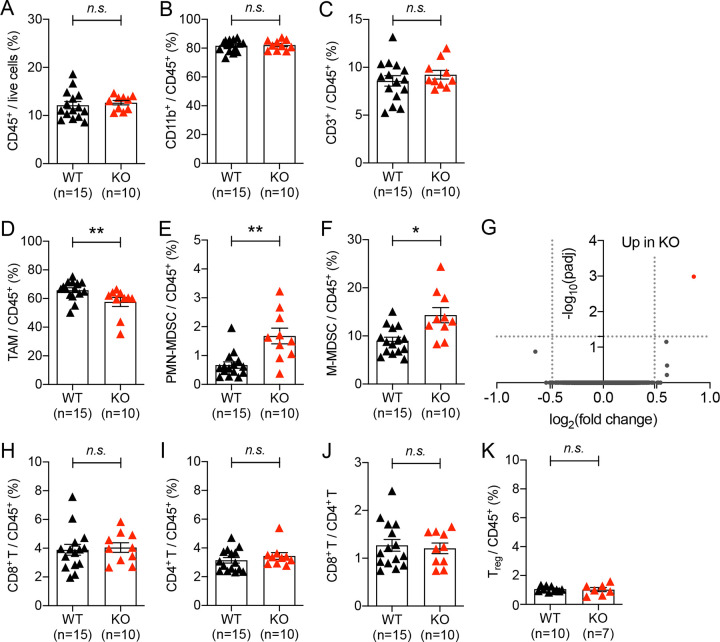
Figure 2. Impact of autophagy deficiency in myeloid cells on immune cell recruitment in implanted tumors.
Tumor infiltrated immune cells were analyzed 21 days after 1×10⁵ MC38 cells were subcutaneously implanted into WT (Atg5flox/flox) and KO (Atg5flox/flox+LysMcre) mice. (A) Percentage of immune cells within the live cell population in tumor tissue. (B-F, H, I, K) Percentage of (B) myeloid cell (C) T lymphocyte (D) tumor associated macrophages, CD11b+ Ly6G− Ly6C−, (E) polymorphonuclear MDSCs, CD11b+ Ly6Ghigh Ly6Clow, (F) monocytic MDSCs, CD11b+ Ly6G− Ly6Chigh, (H) CD8+ T cells, CD3+ CD8+, (I) CD4+ T cells, CD3+ CD4+ (K) regulatory T cells, CD3+ CD4+ CD25+ Foxp3+, within CD45+ population in tumor tissue. Total number of mice used for each study (n) are indicated in each figure, and each data point represents each mouse. Error bars indicate mean +/− SEM, and statistical significance was calculated with Mann-Whitney test. *p < 0.05, **p < 0.01, n.s.: not significant. (G) Gene expression from TAMs were analyzed by RNA-seq. Volcano plot shows the log2(fold change) in the expression of genes in TAMs from KO (Atg5flox/flox+LysMcre) mice compared to WT (Atg5flox/flox) mice. n=4 per group. Horizontal dashed line indicates the -log10 (padj) of 1.3 and vertical dashed line indicates the log2 (fold change) of +/− 0.48. (J) The ratio of CD8+ T cells to CD4+ T cells.

