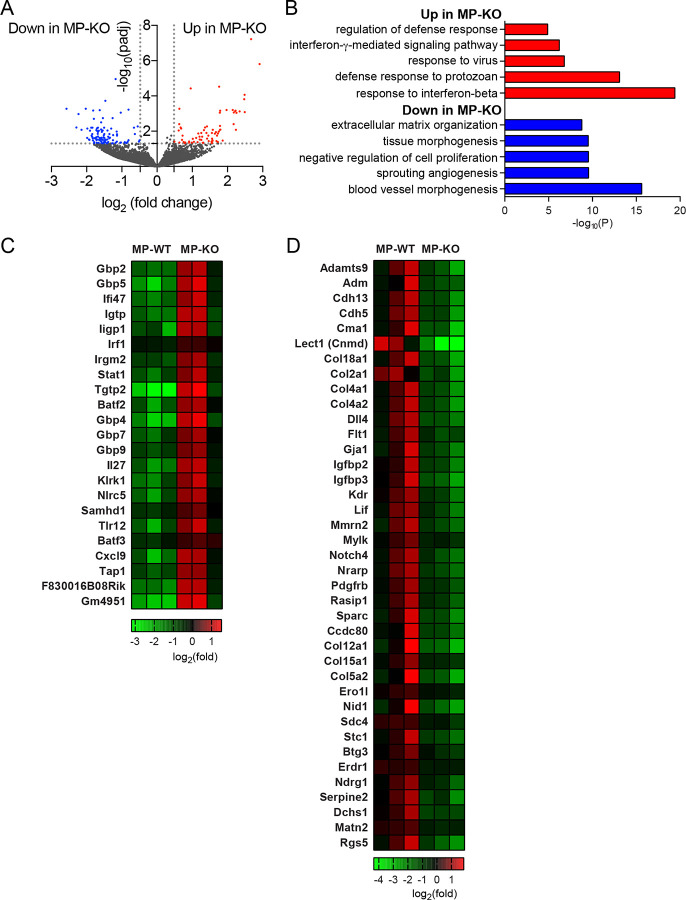
Figure 6. RNA-seq analysis of TAMs from genetically induced tumors.
Tumors from 65day-old mice, MMTV-PyMT + Atg5flox/flox (MP-WT) and MMTV-PyMT + Atg5flox/flox + LysMcre (MPKO), were collected and TAMs were isolated. Gene expression from TAMs were analyzed by RNA-seq. n=3 per group. (A) Volcano plot shows the log2(fold change) in the expression of genes in TAMs from the MP-KO mice compared to the MP-WT mice. Horizontal dashed line indicates the -log10 (padj) of 1.3 and vertical dashed line indicates the log2 (fold change) of +/− 0.48. (B) Gene ontology of differentially expressed genes indicated as red and blue dots in the volcano plot (A). Top 5 gene ontology are depicted. (C) Heatmap showing expression level of genes that are up-regulated in MP-KO mice assigned to the top 5 gene ontology. (D) Heatmap showing expression level of genes that are down-regulated in MP-KO mice assigned to the top 5 gene ontology.

