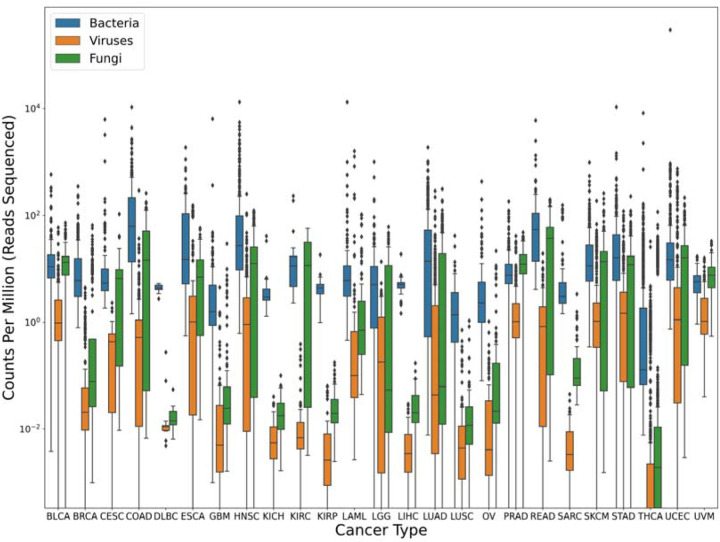
Figure 1.
Microbial content found in TCGA data from 25 cancer types. Box plots show the inter-quartile range of read counts for the samples from each cancer type, with a horizontal line indicating the mean value. On average, bacteria (blue) had much higher read counts than fungi (green), or viruses (orange). Read counts were normalized by the number of reads sequenced in each sample, in millions; i.e., a value of 10 indicates 10 reads for every million reads in the sequencing run. Note that no adjustments were made for genome size here, which explains the much smaller read counts for viruses. For clarity, the y-axis uses a log scale.

