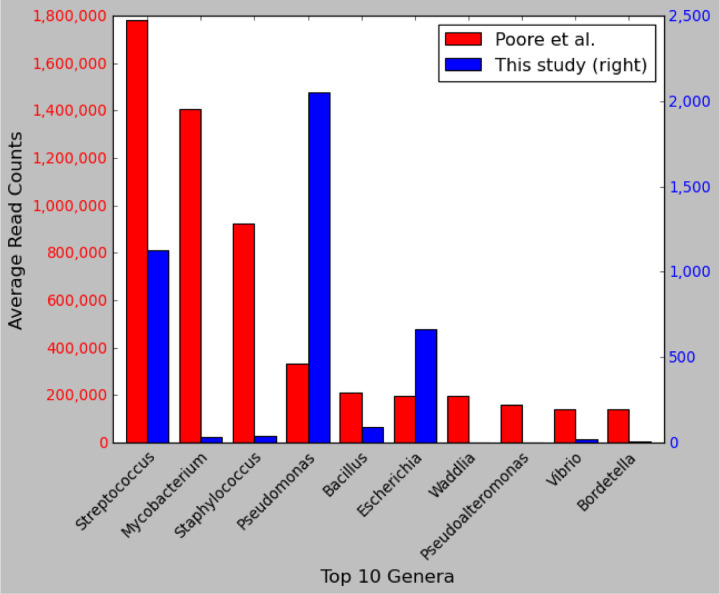
Figure 4.
Comparison of read counts for the top 10 microbial genera from a previous study. Shown are the top ten most-abundant genera ranked by the average number of reads reported in Poore et al. (1) across 4,550 WGS samples from 25 cancer types. The left axis shows read counts as reported by Poore et al., and the right axis shows read counts as computed in our re-analysis of the same samples and the same species. Note that the y-axis scales differ by a factor of ~700. The x-axis shows genus names.

