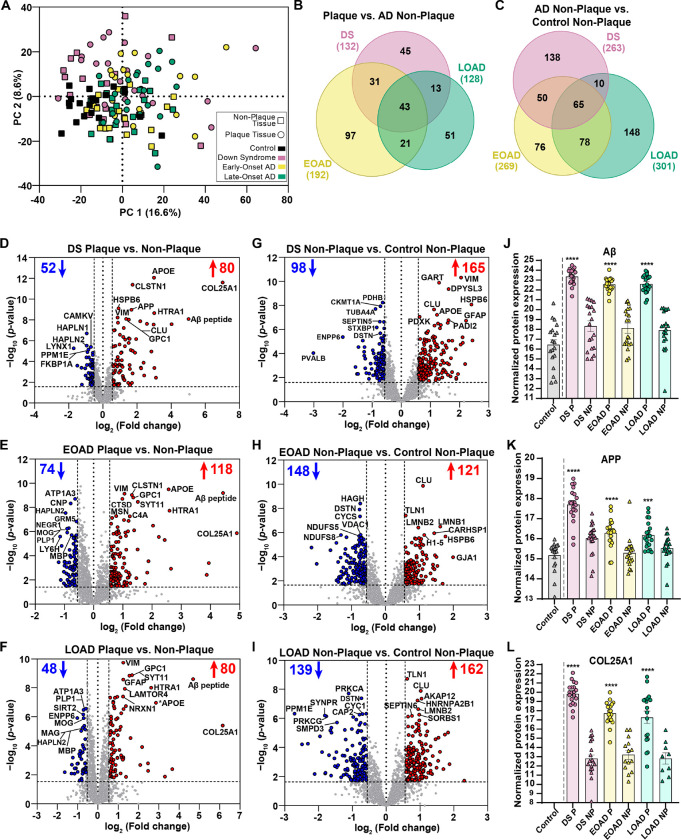
Figure 2.
Principal component analysis (PCA) and differential protein expression in Aβ plaques and non-plaque tissue. A. PCA shows the distribution of the n=20 cases per each experimental group, with minimal segregation. B. Venn diagram of differentially abundant Aβ plaque proteins shows 43 common proteins for all the AD subtypes evaluated, 45 for DS, 97 for EOAD and 51 for LOAD. C. Venn diagram of differentially abundant non-plaque proteins depicts 138 proteins in DS, 76 proteins in EOAD, 148 proteins in LOAD, and 65 common proteins for all AD subtypes. D-F. Volcano plots indicate differentially expressed proteins (enriched in red, decreased in blue) in Aβ plaques compared to non-plaque tissue in DS (132 proteins, D), EOAD (192 proteins, E) and LOAD (128 proteins, F). G-I. Volcano plots depict differentially expressed proteins in DS non-plaque tissue compared to controls (263 proteins, G), EOAD non-plaques (269 proteins, H) and LOAD non-plaques (301 proteins, I). (J-L). Normalized protein expression obtained from the label-free quantitative mass spectrometry proteomics of Aβ peptide (J), APP protein (K) and COL25A1 (L). Significance was determined using a student’s two-tailed t test (FDR < 5%, fold-change > 1.5). P values are indicated based on the pairwise comparisons. *** p<0.001, *** P<0.0001. Error bars indicate standard error of the mean (SEM). Significant pairwise comparisons are indicated for those analyses that were performed, controls are shown as reference.

