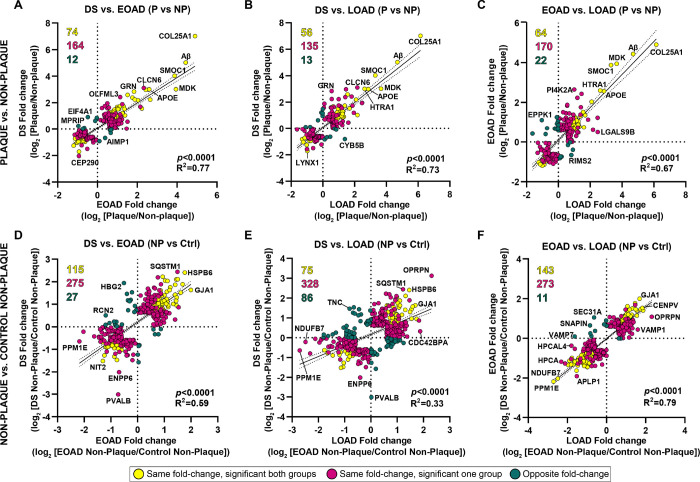
Figure 3.
Correlation analyses of differentially abundant proteins in Aβ plaques and non-plaque tissue. (A-C) Correlation analyses for significant proteins in Aβ plaques vs non-plaque tissue and (D-F) DS, EOAD and LOAD non-plaque vs control non-plaque tissue. Yellow dots represent proteins changing in the same direction (highly abundant or less abundant proteins in both groups evaluated) and that are significant for both groups compared. Magenta dots represent proteins changing in the same direction, but are significant only in one of the groups evaluated. Green dots represent proteins changing in opposite direction (i.e., abundant in one group and less abundant in the other group evaluated). Numbers are colored to match the dots. Proteins were selected for the correlation analysis if they were significant at least in one of the groups compared and its fold change > 1.5. We observed a positive correlation between DS vs. EOAD (A) (p<0.0001, R2=0.77, (B) DS vs. LOAD (p<0.0001, R2=0.73) and (C) EOAD vs. LOAD (p<0.0001 R2=0.67). There is also a positive correlation when comparing non-plaque proteins in (D) DS vs. EOAD (p<0.0001 R2=0.59) and (E) DS vs. LOAD p<0.0001, R2=0.33). H. Correlation between EOAD and LOAD non-plaque proteins p<0.0001, R2=0.79).

