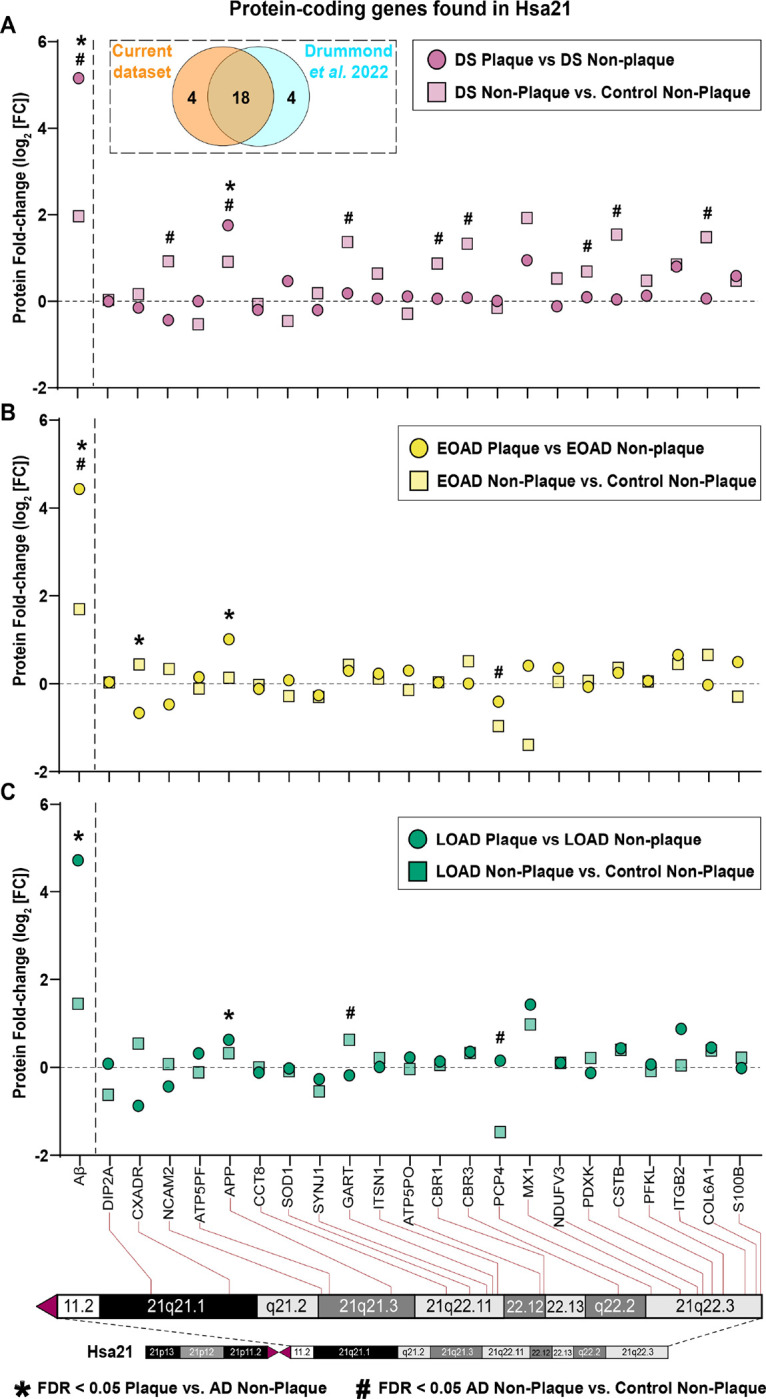
Figure 4.

Mapping protein-coding genes to chromosome 21 (Hsa21). A. Dashed box contains Venn diagram of proteins from genes in Hsa21 identified in the current study vs. Drummond et al. 2022, (12). (A-C) The figure depicts fold change (Log2 FC) of the twenty-two Hsa21 genes whose corresponding protein products were found in Aβ plaques (circles) or neighboring non-plaque tissue (squares) in DS (E), EOAD (F) and LOAD (G). Paired two-tailed t tests (plaques vs. non-plaques) or unpaired two-tailed t tests (non-plaques vs. control) with permutation correction at a 5% FDR are indicated. Aβ peptide is shown as reference.
