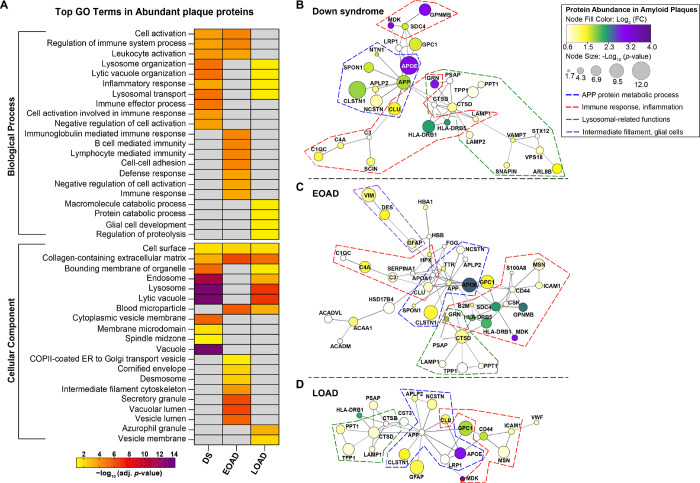
Figure 5.
Gene ontology annotation and protein-protein interaction networks of significantly abundant proteins in Aβ plaques. A. GO terms heatmap depicts top 10 enriched BP and CC GO terms for significantly abundant Aβ plaque proteins in DS, EOAD and LOAD. Color indicates the adjusted p-value <0.05 (−Log10 [adj. p-value]). (B-D) Protein networks (PPI Enrichment p=1 × 10⁻¹⁶) show functional and physical amyloid plaques protein associations in DS (B), EOAD (C) and LOAD (D). Node color indicates fold-change (log2 [FC]) and node size depicts adjusted p-value (−log10 [p-value]) from the student’s two-tailed t test. Disconnected nodes are not shown in the network. Colored dotted lines highlight groups of proteins based on functions/pathways observed in the GO terms; Blue: APP protein metabolic process, Red: immune response and inflammation, Green: lysosomal-related functions, Purple: intermediate filament proteins, glial cells. GO terms annotation was performed using R package clusterProfiler v 4.8.2. PPI networks were created in Cytoscape v 3.10.0 using STRING database v 11.5.

